2022
7 weeks
7 weeks
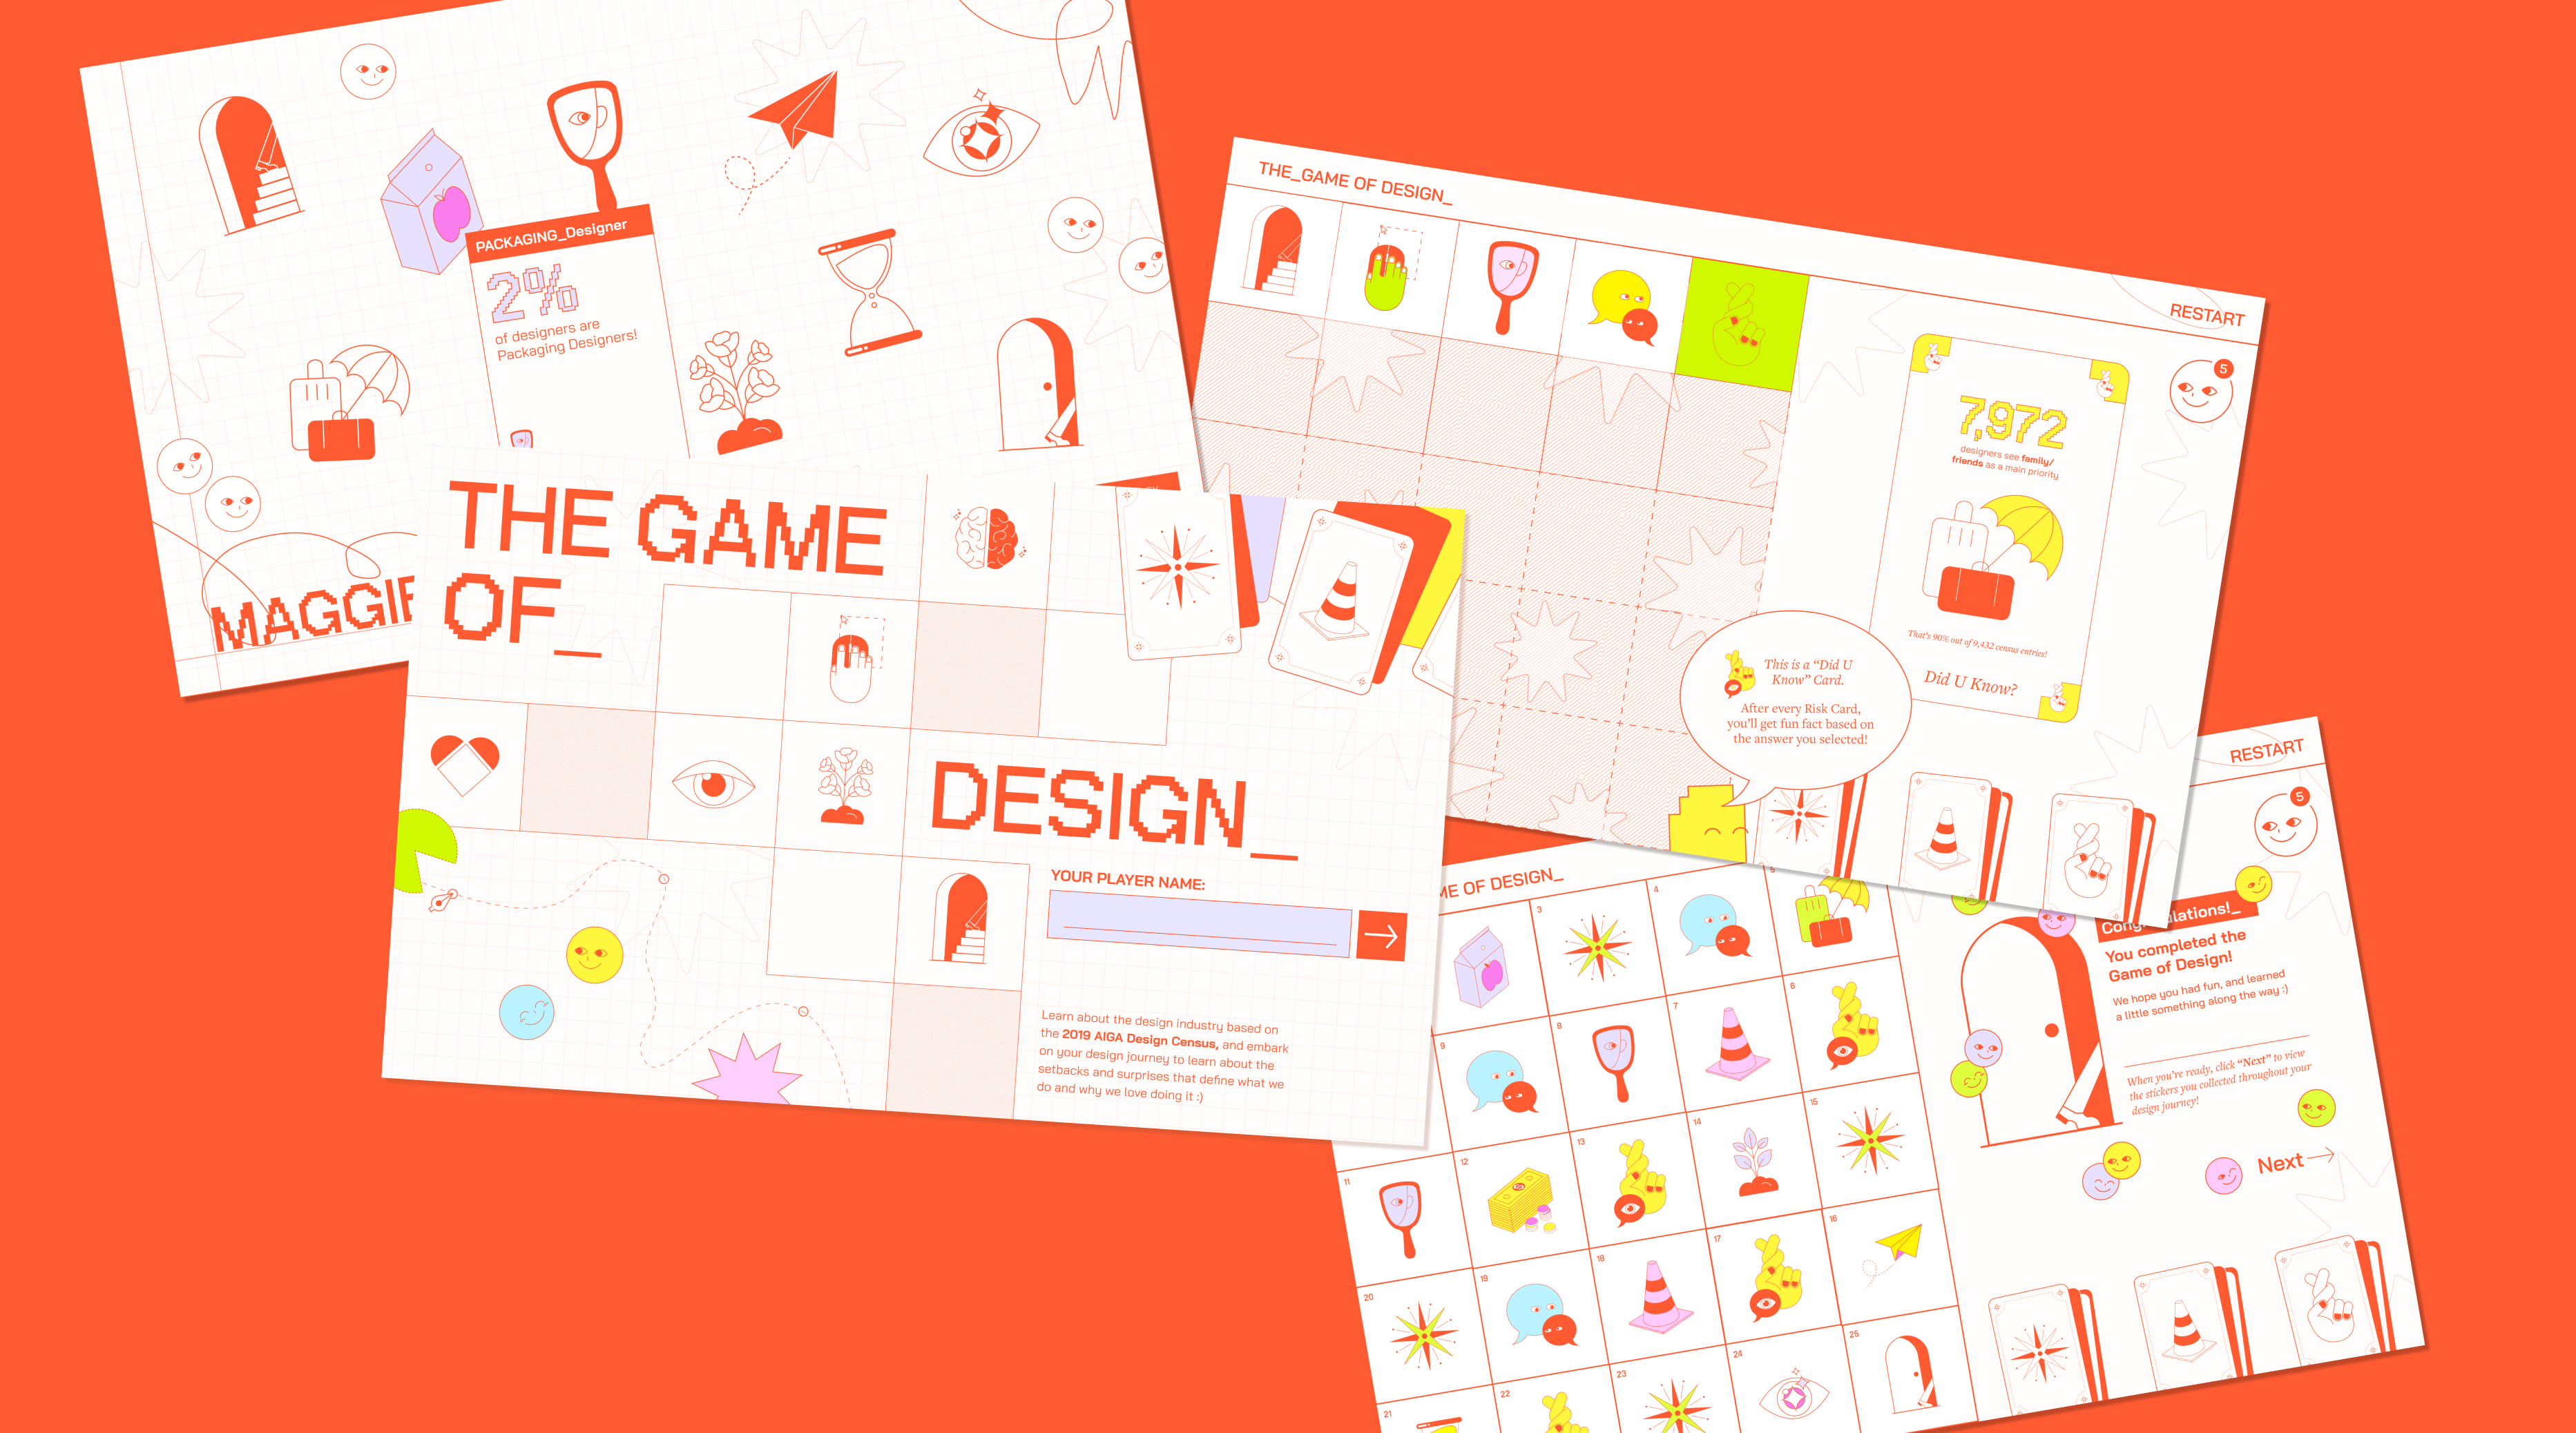
The_Game of Design_ is a digital board game of a designer’s journey
The AIGA Design Census is a comprehensive report featuring 9,432 entries that highlight both factual and emotional aspects of the design industry. To showcase this intricate data, our team created an interactive board game, allowing designers to learn more about their place in the community.
I was responsible for developing branding, illustrations, and UI/UX prototypes.
Skills
Branding
Illustration
Web Design
Data Visualization
Teammates
Dorothy Li
Maggie Ma
Branding
Illustration
Web Design
Data Visualization
Teammates
Dorothy Li
Maggie Ma
Concept - A Digital Board Game
As designers, we each embark on unique journeys of growth and self-discovery. Our board game visualizes the realities of the design industry by curating personalized gameplay based on the user’s background in design.
How might we educate designers about their place in the current industry?
As designers, we each embark on unique journeys of growth and self-discovery. Our board game visualizes the realities of the design industry by curating personalized gameplay based on the user’s background in design.
The Site
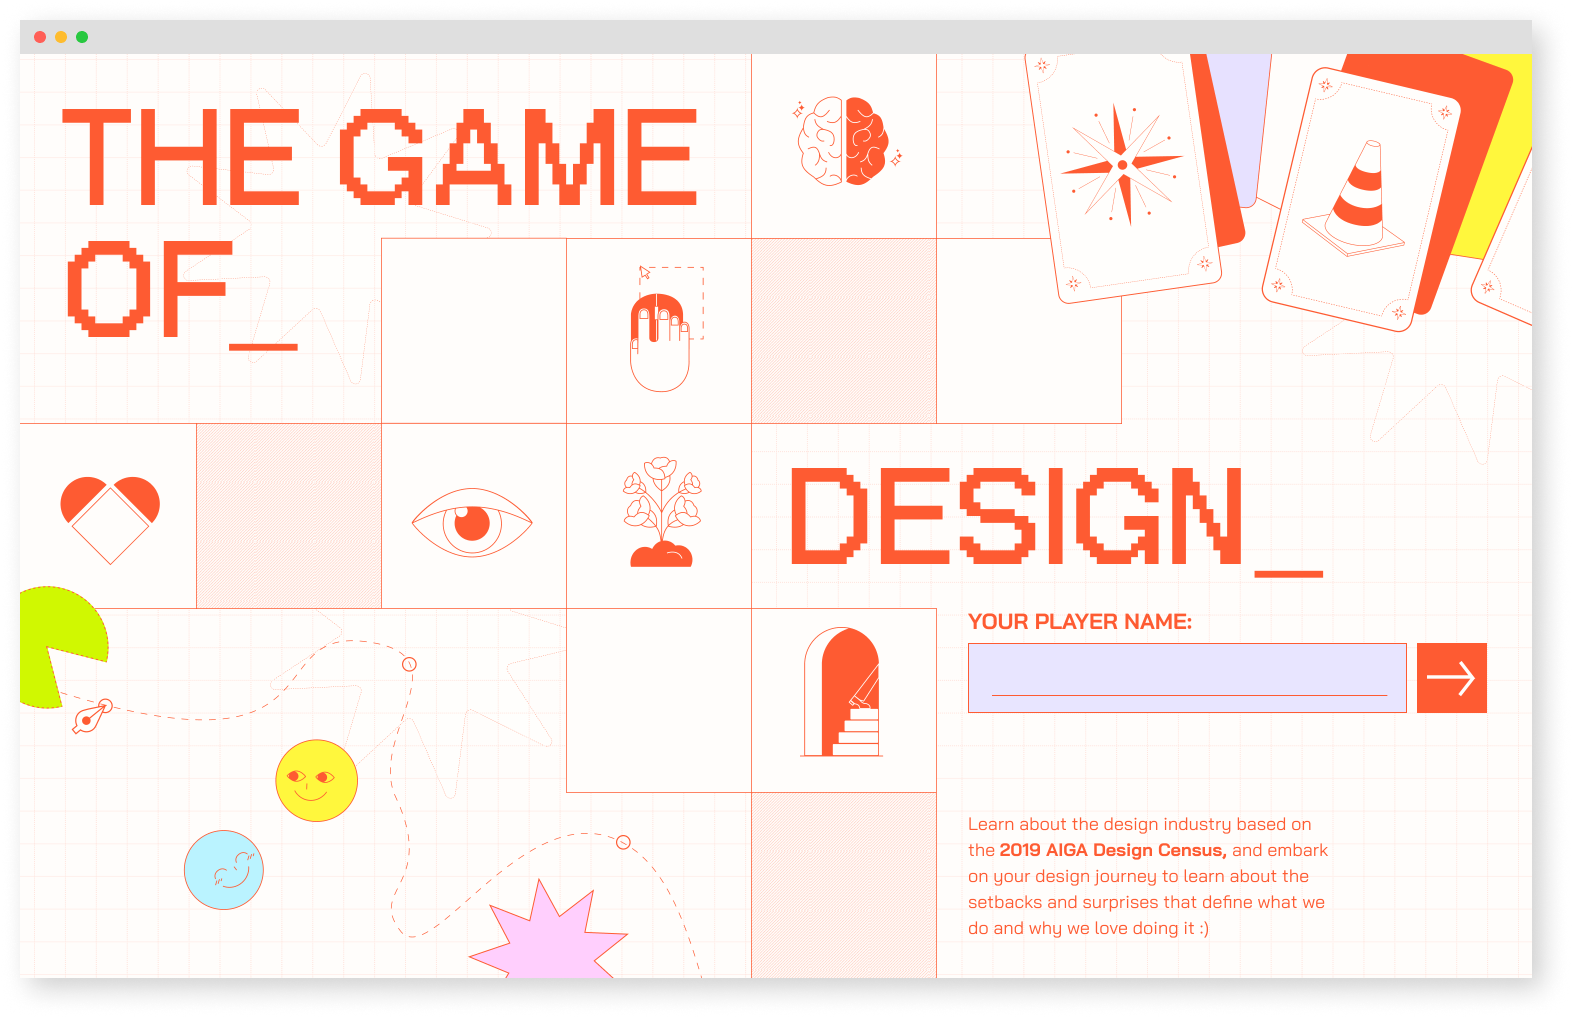
The site features a board game-like navigation, where each block triggers an interaction. To add a sense of unpredictability, the overall board remains hidden until the user reaches each new block.
The site features a board game-like navigation, where each block triggers an interaction. To add a sense of unpredictability, the overall board remains hidden until the user reaches each new block.
Landing Page
![]()
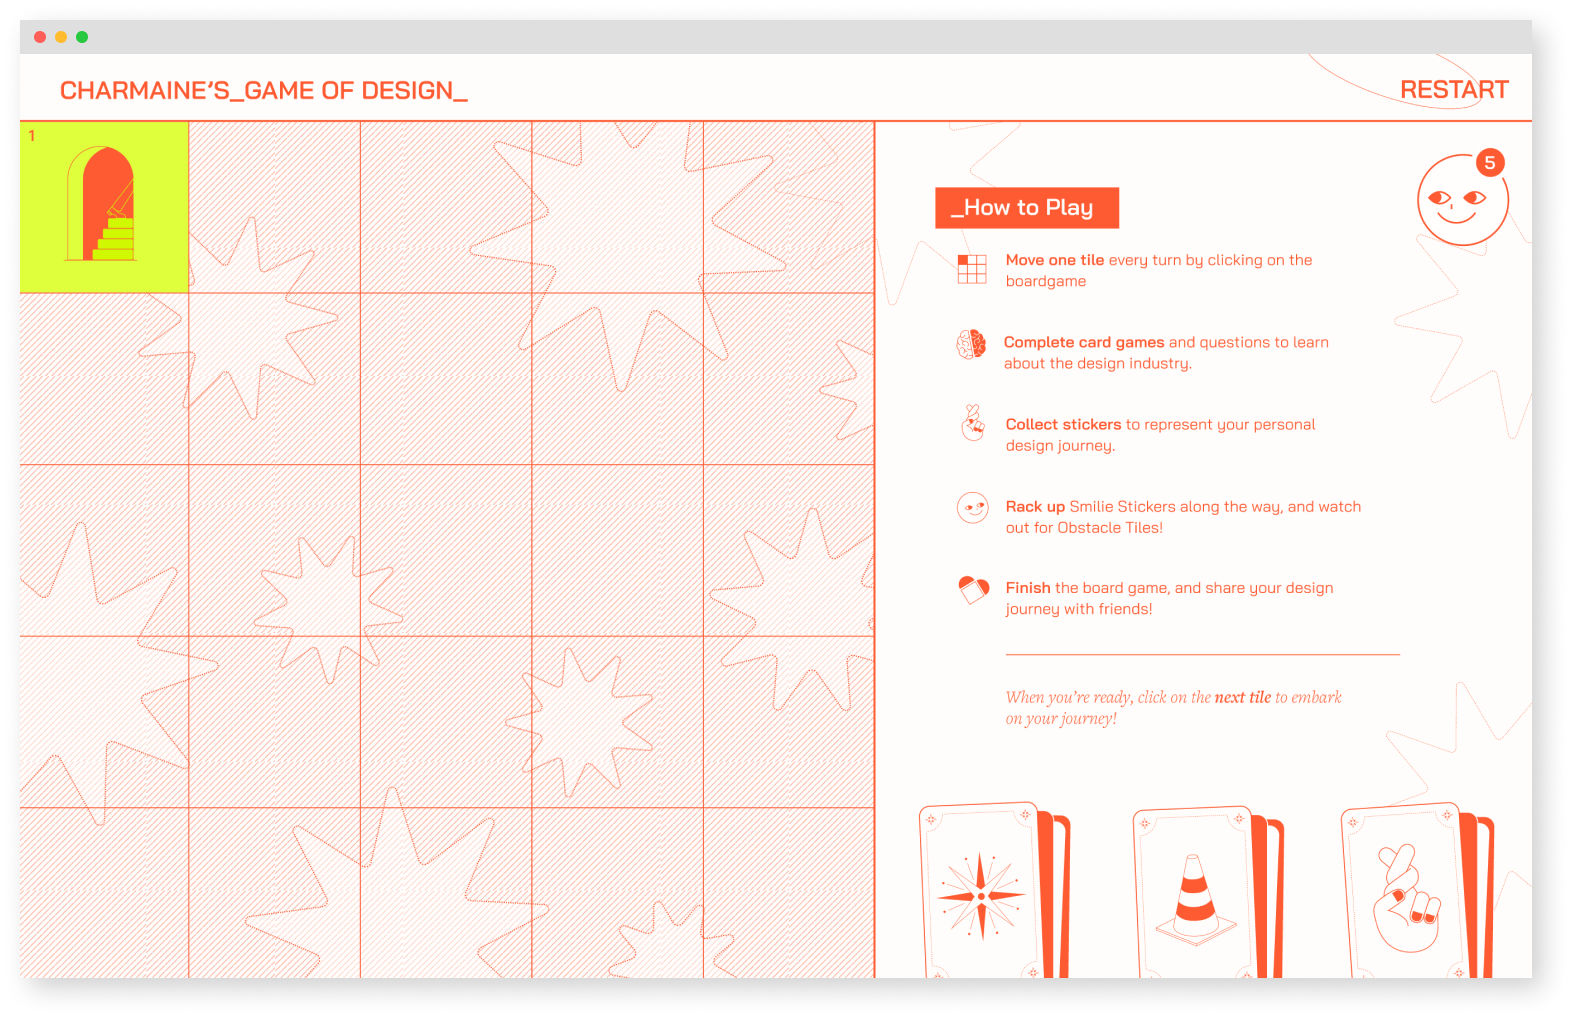
Instruction Page
![]()
Instruction Page
User Flow
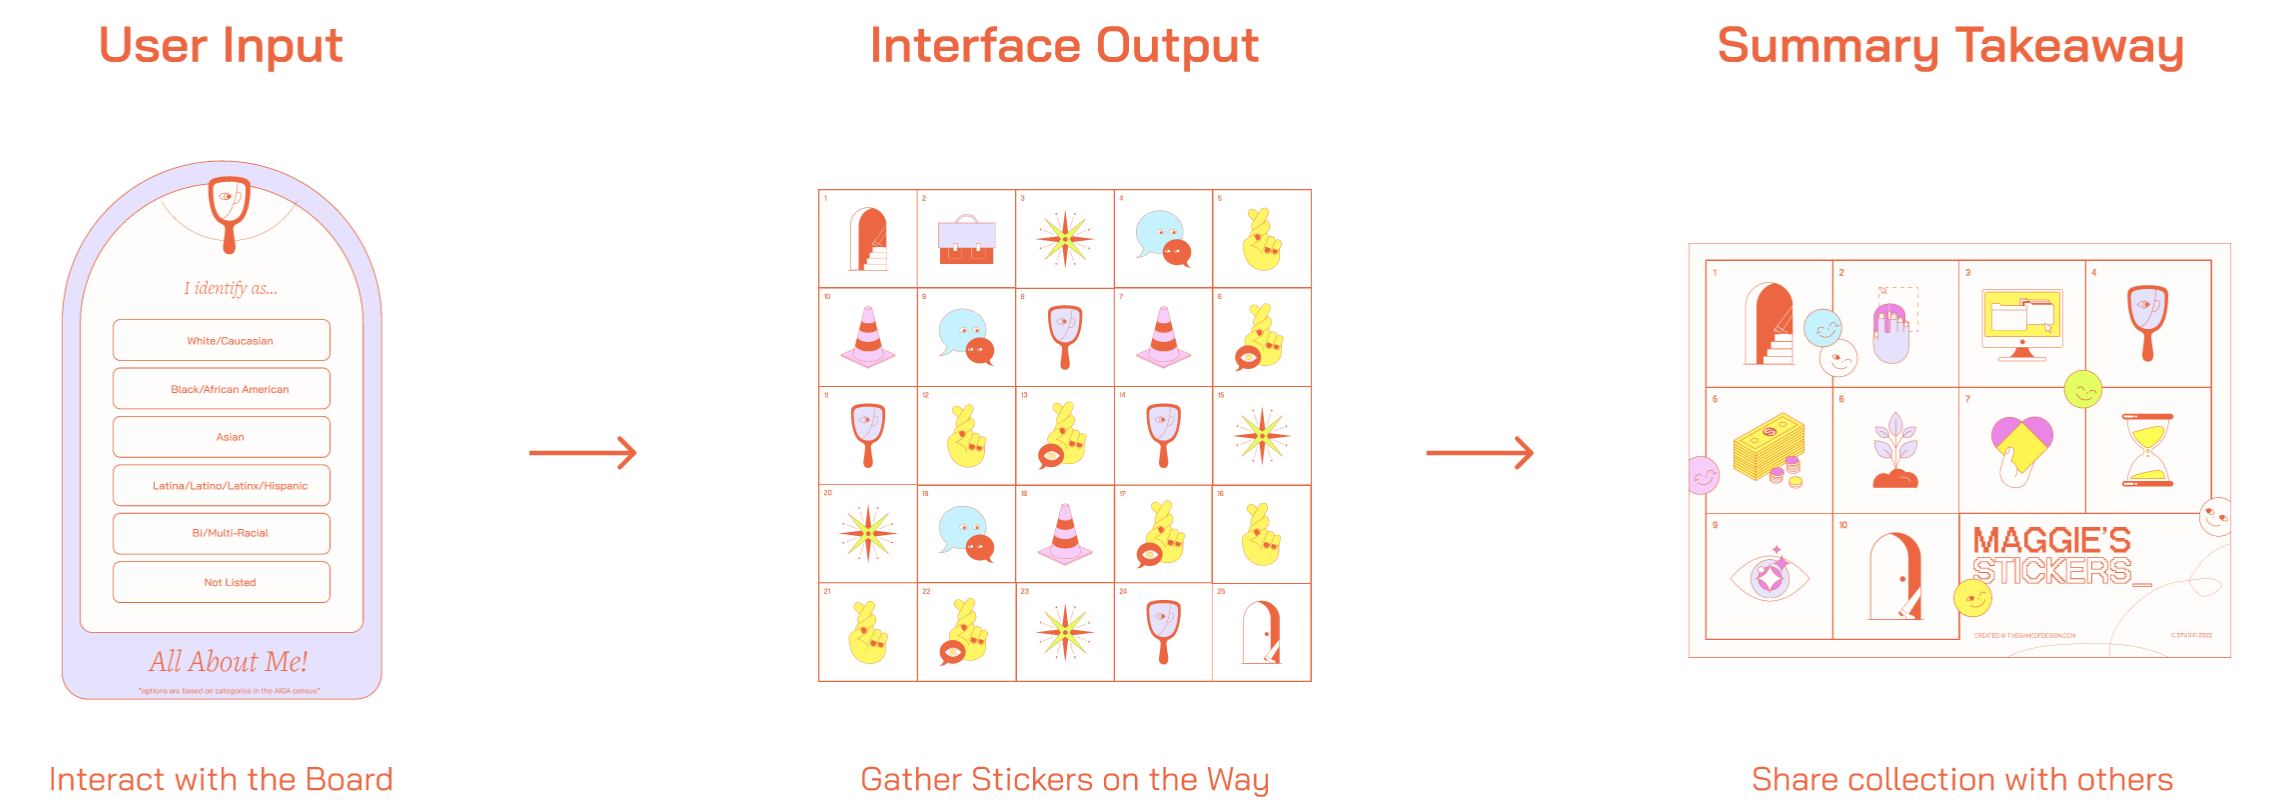
The player navigates through 25 blocks on the board by interacting with cards that appear on each block. By inputting their answers on the cards, players collect stickers as rewards. As a final takeaway, players receive a personalized sticker collection that reflects their own statistics, which they can learn from and share with others.
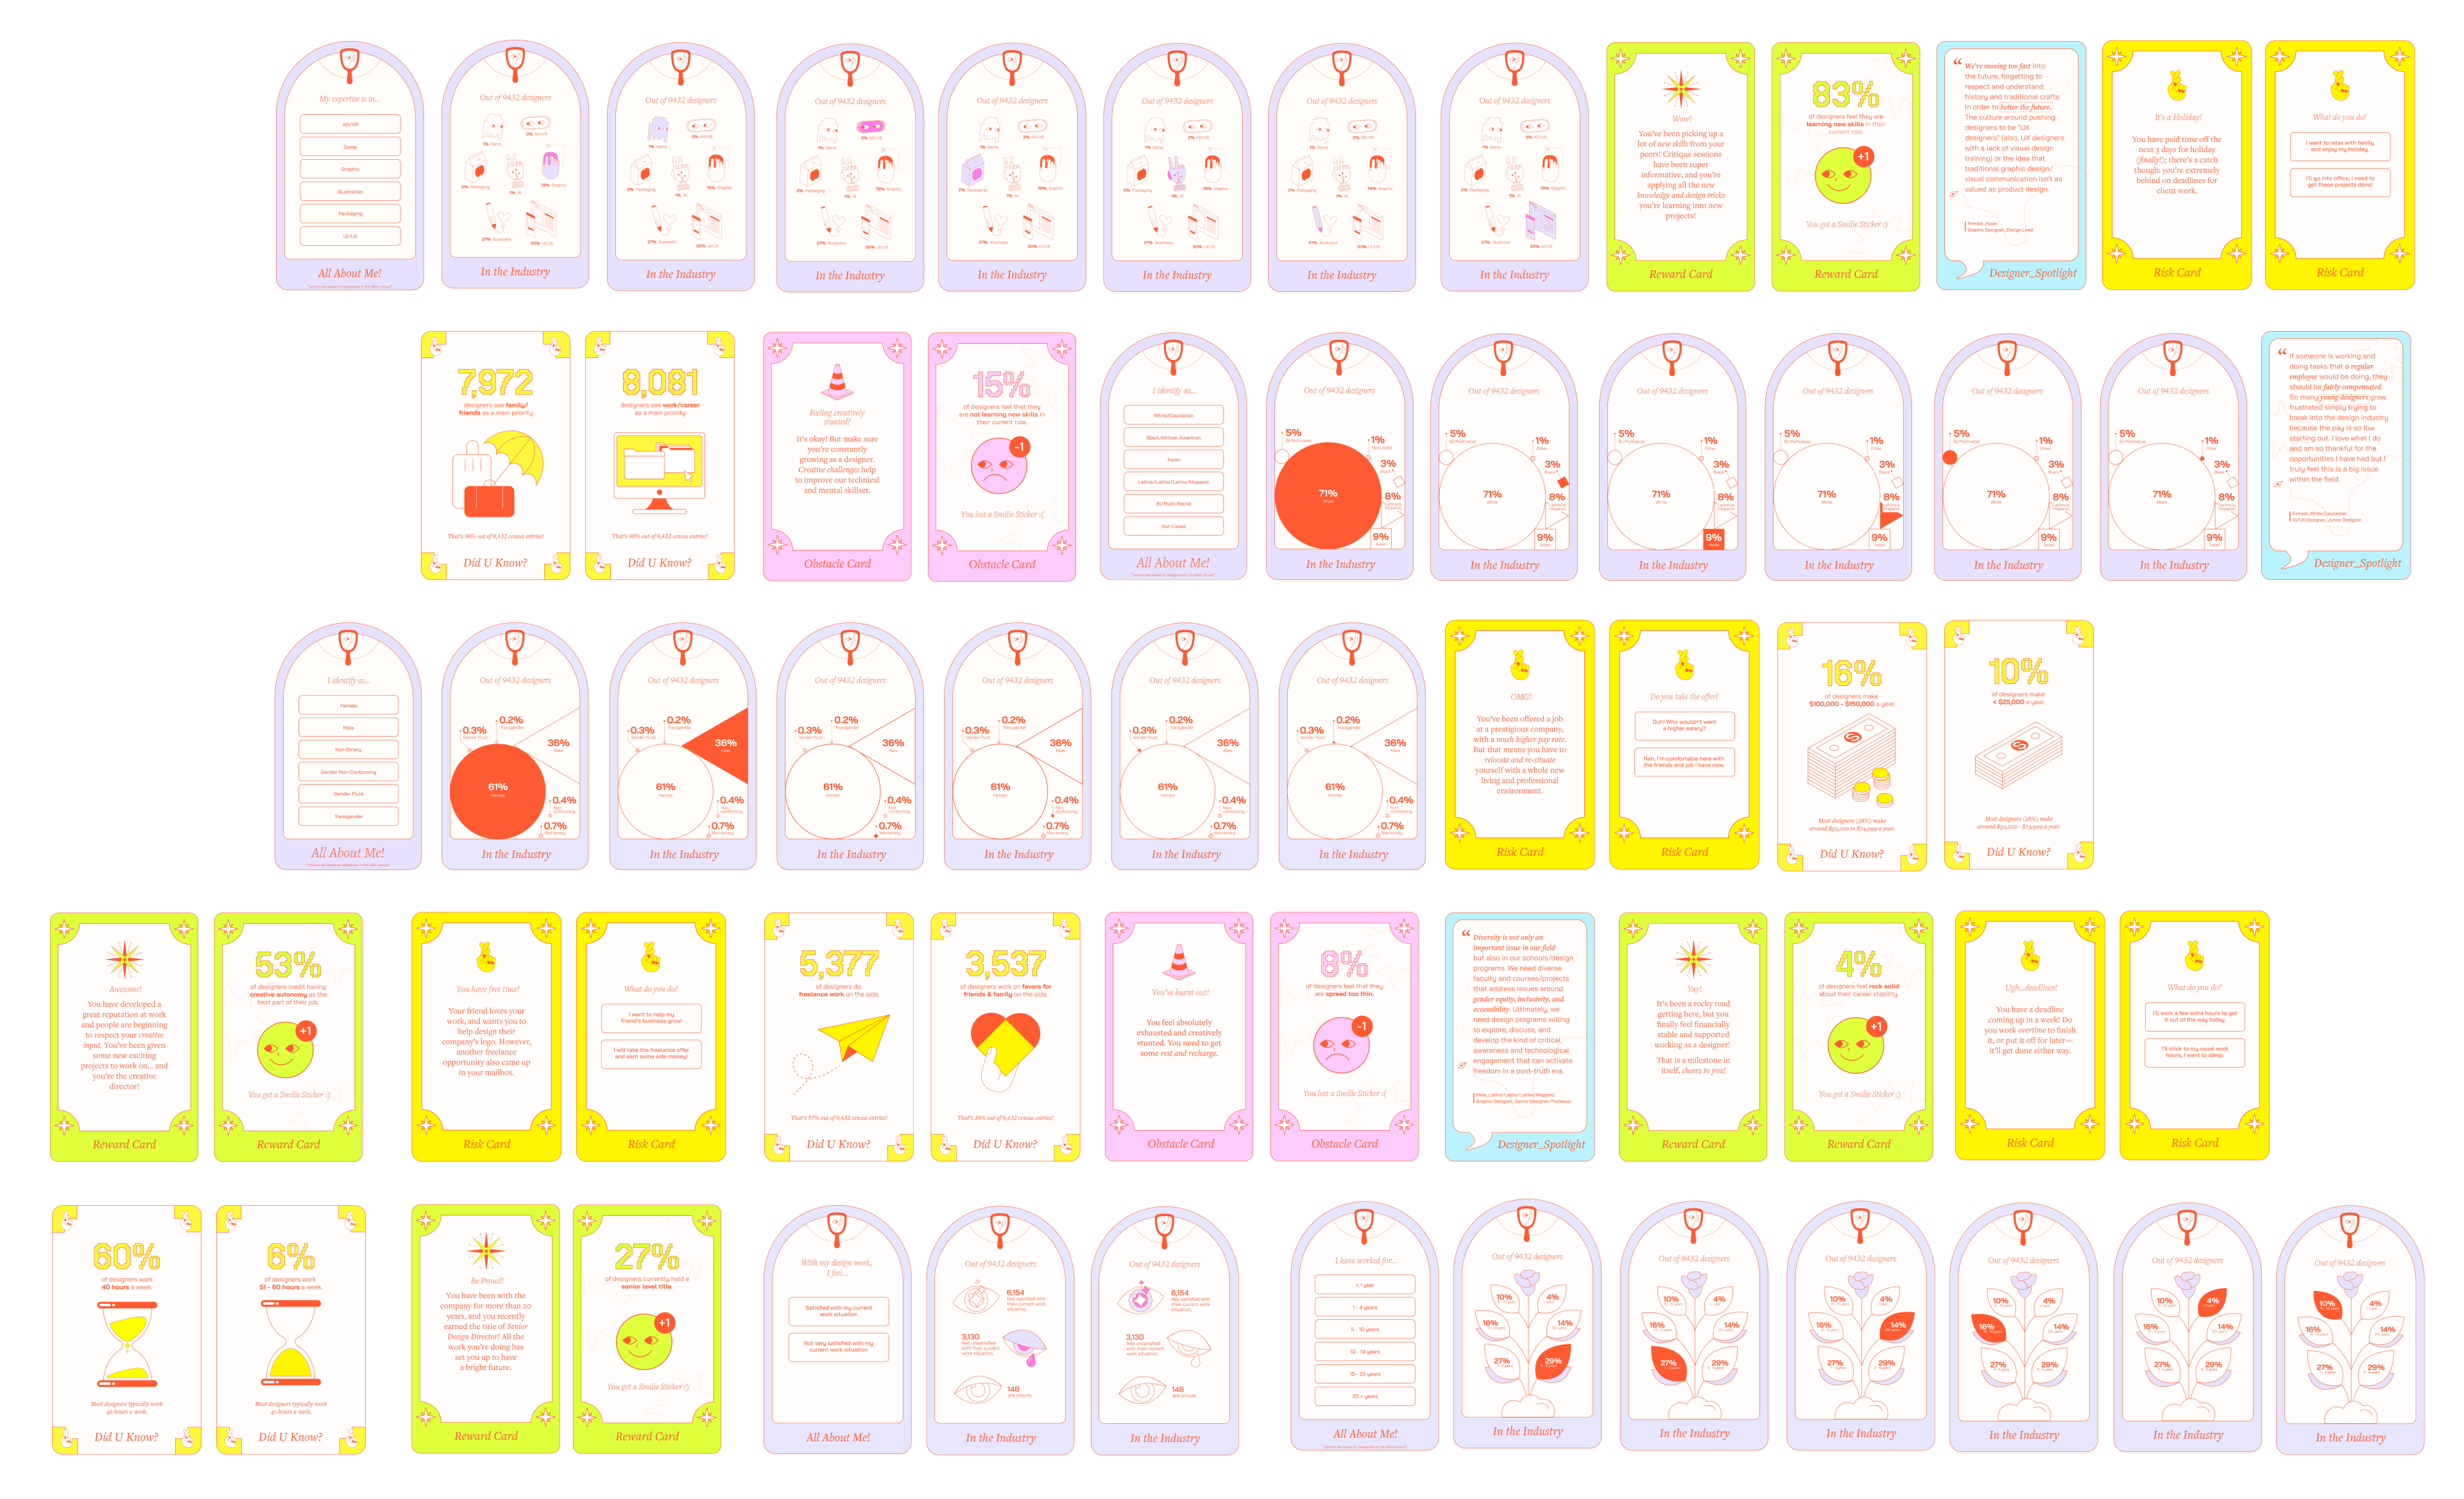
Interacting with Data
The player navigates through 25 blocks on the board by interacting with cards that appear on each block. By inputting their answers on the cards, players collect stickers as rewards. As a final takeaway, players receive a personalized sticker collection that reflects their own statistics, which they can learn from and share with others.
Card Type 01
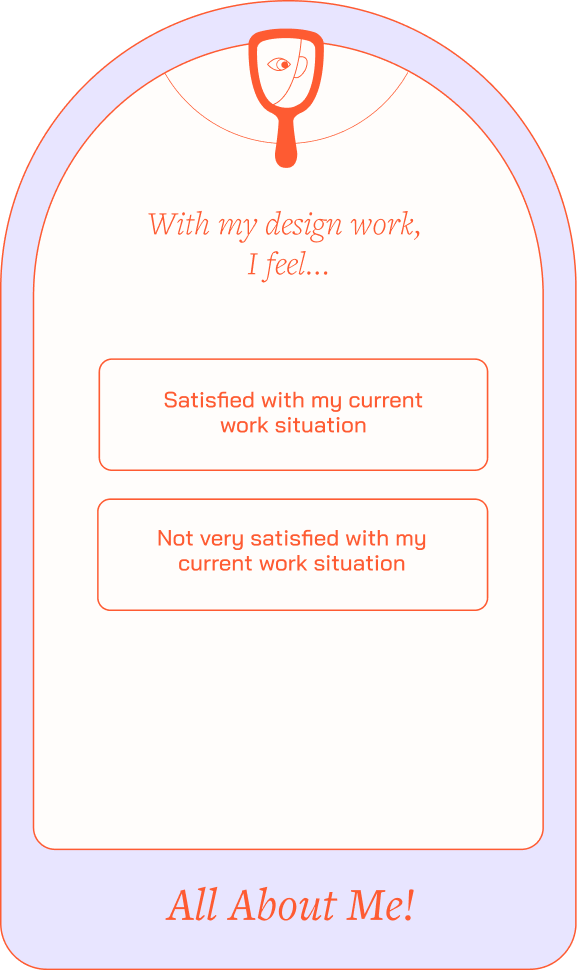
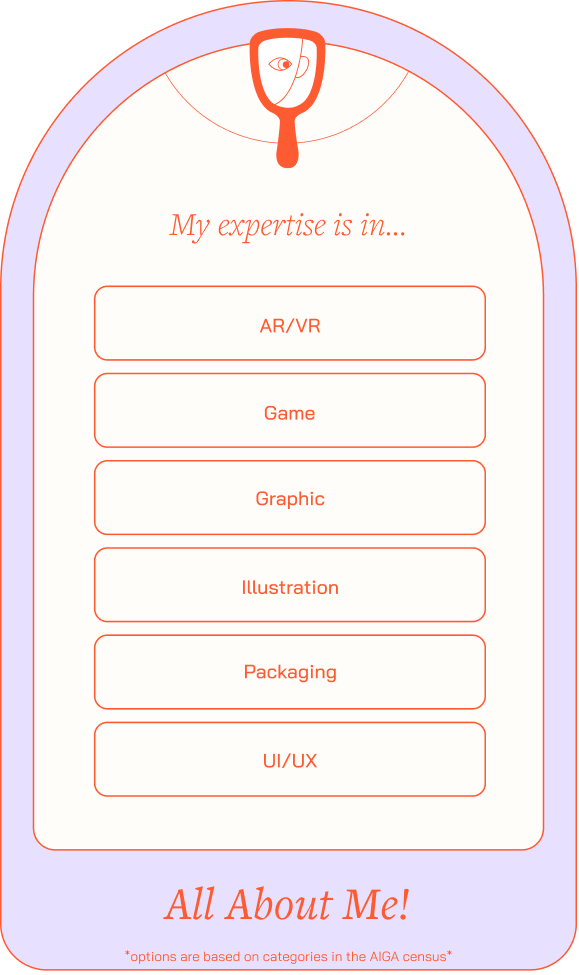
About Me Card
About Me Card
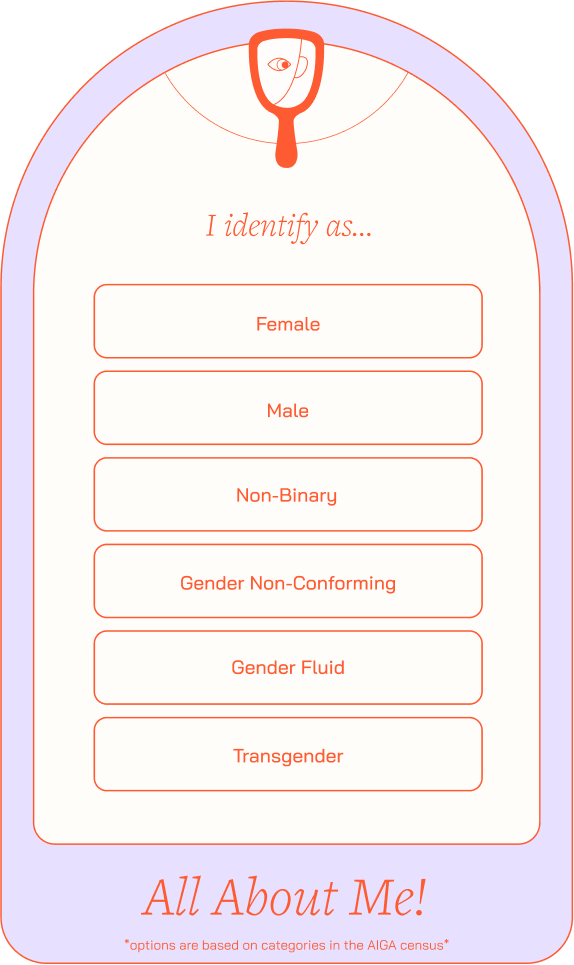
Invites players to provide answers based on their personal experiences and backgrounds.
Click to view variations
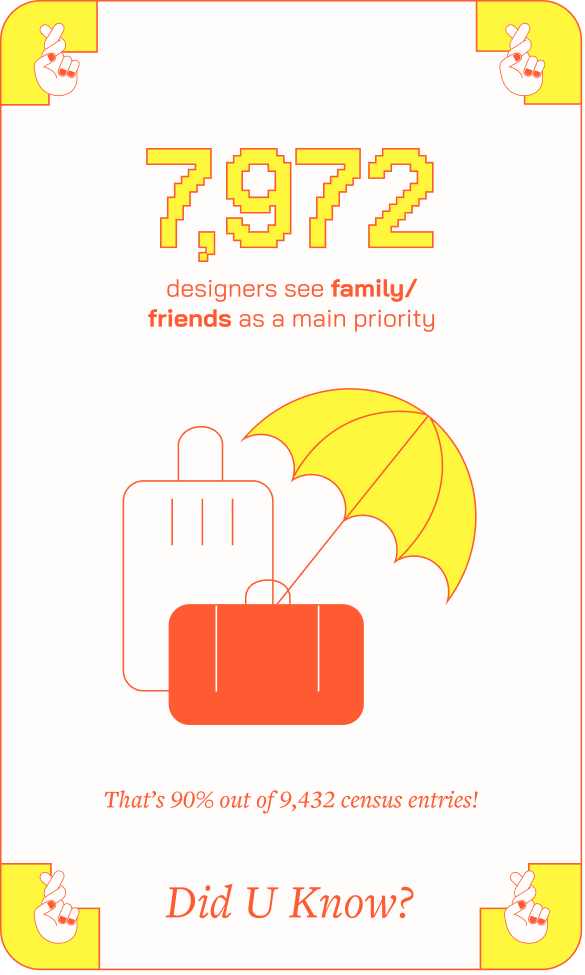
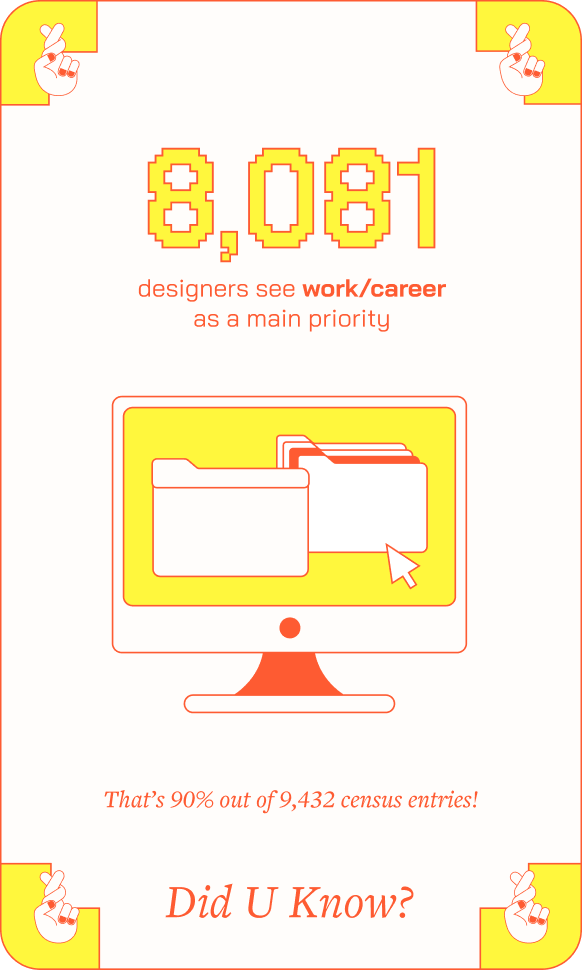
Card Type 02
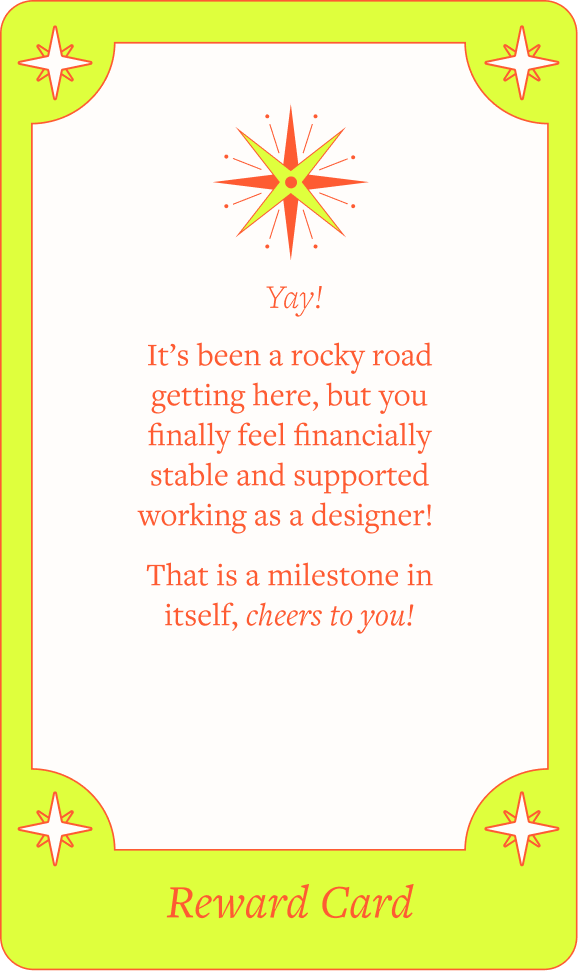
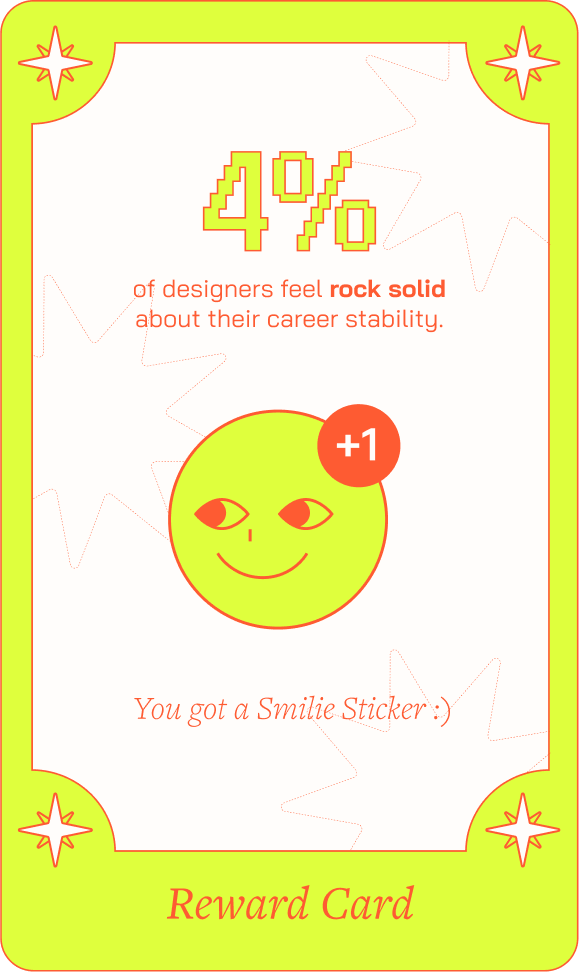
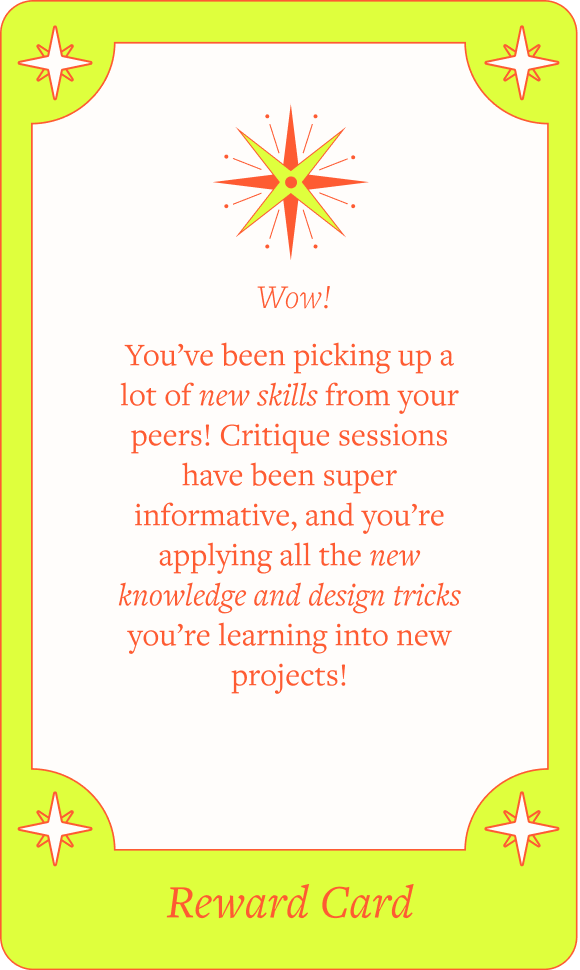
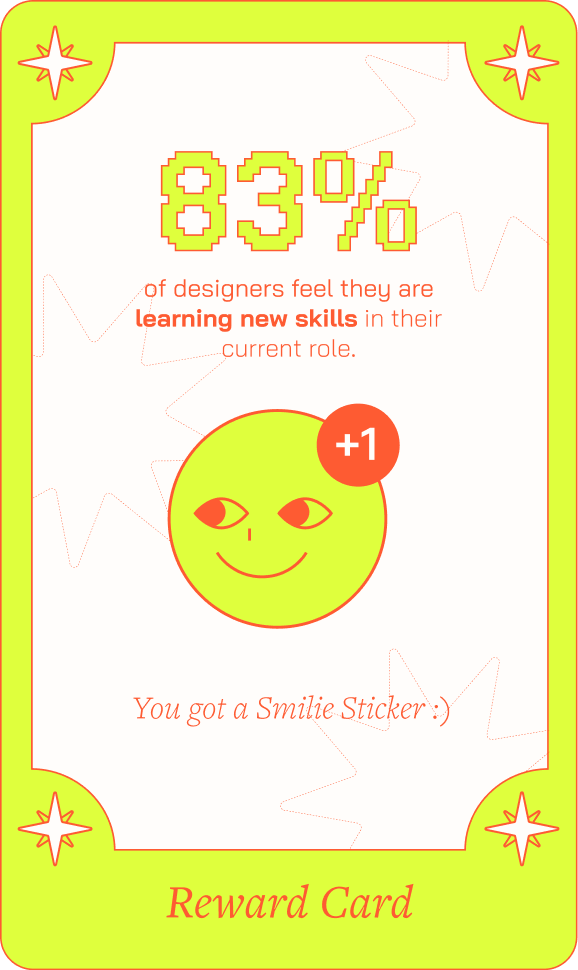
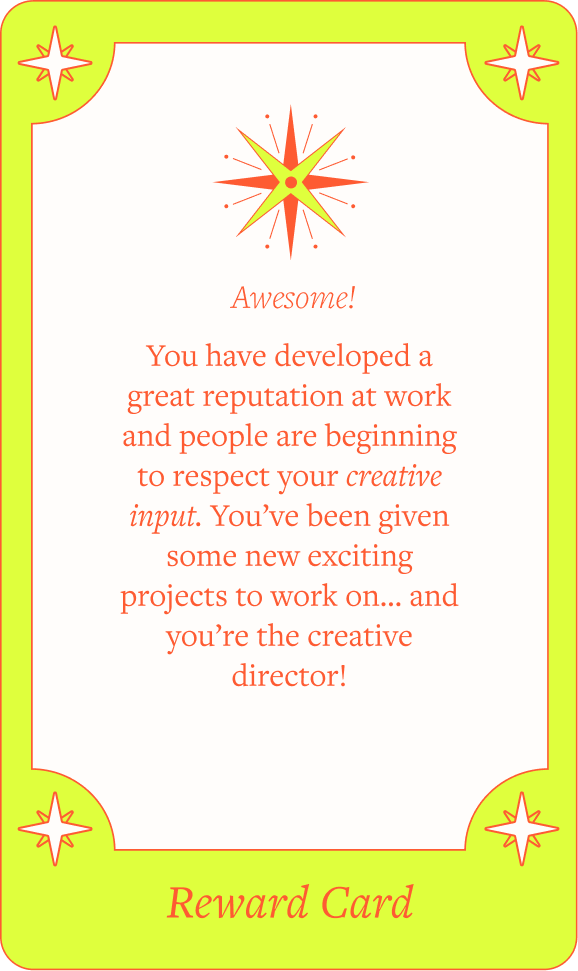
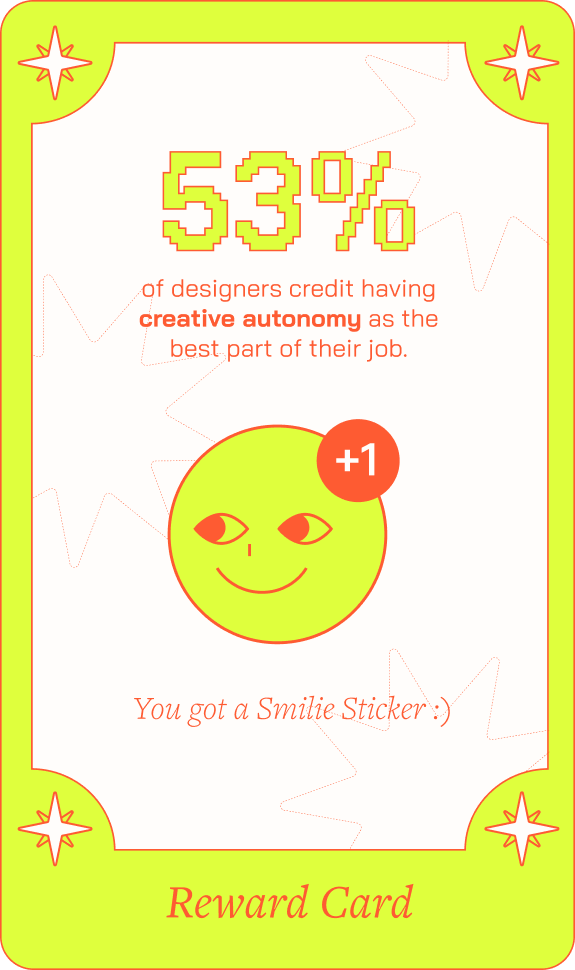
Reward Card
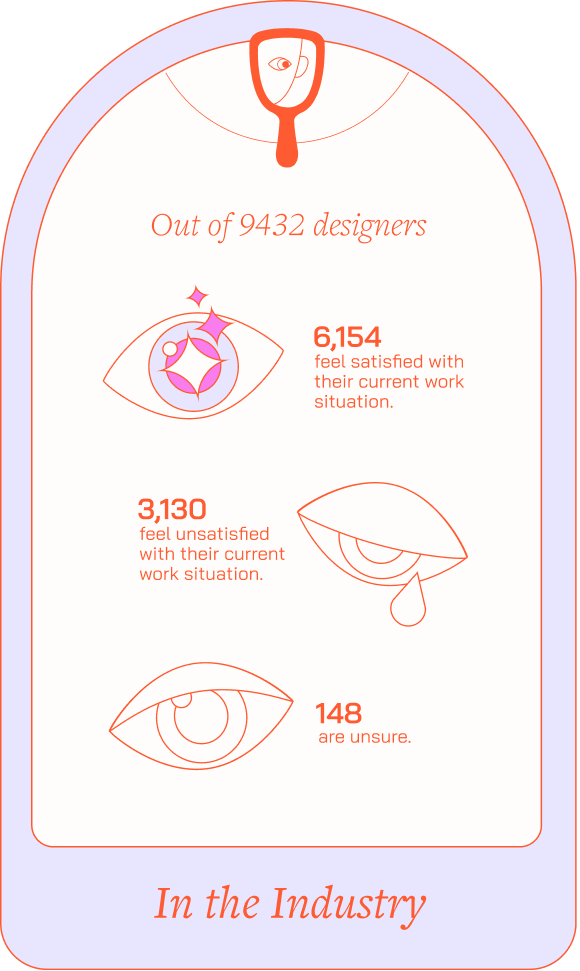
Reward Card
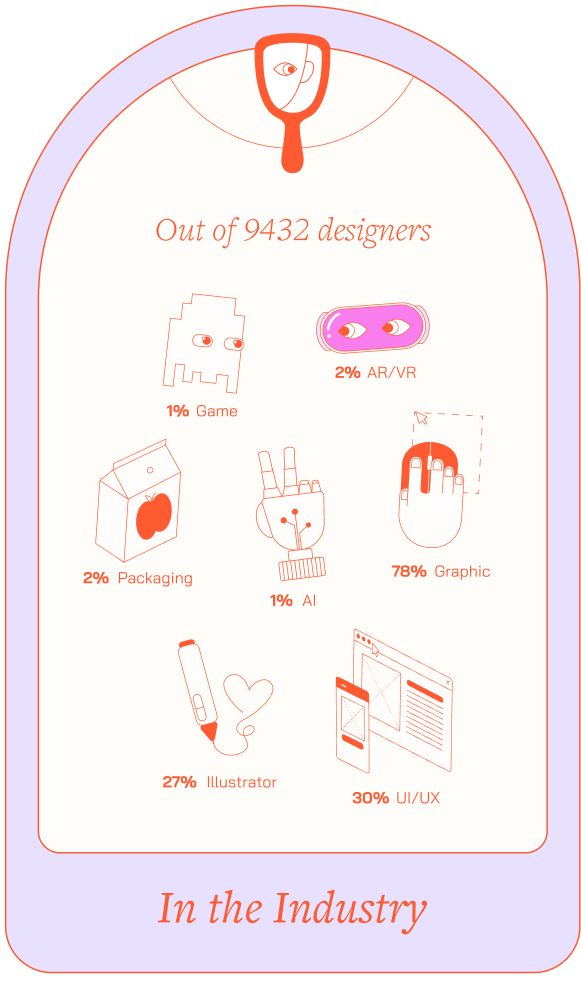
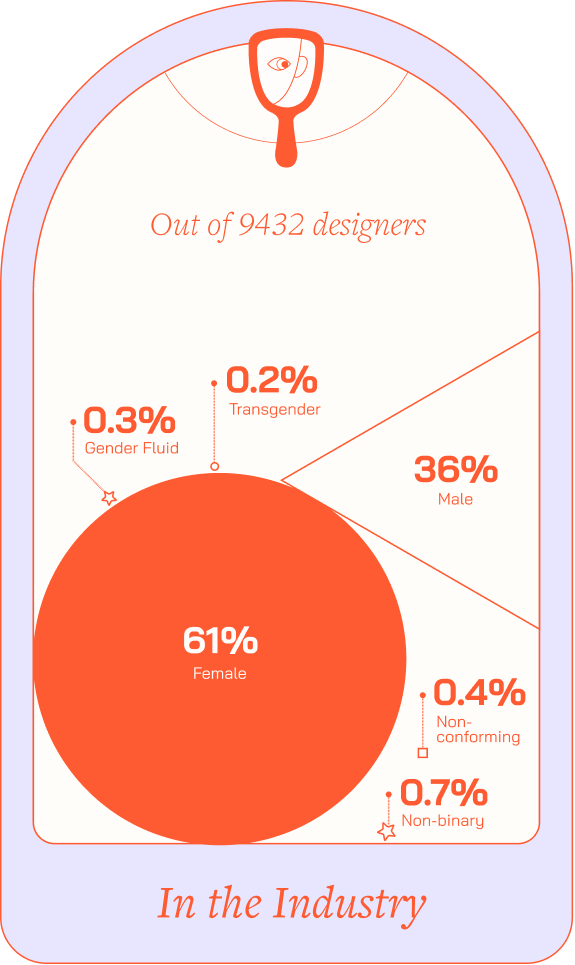
Presents players with a reward scenario where they learn facts about the industry and earn a happy face sticker.
Click to view variations
Card Type 03
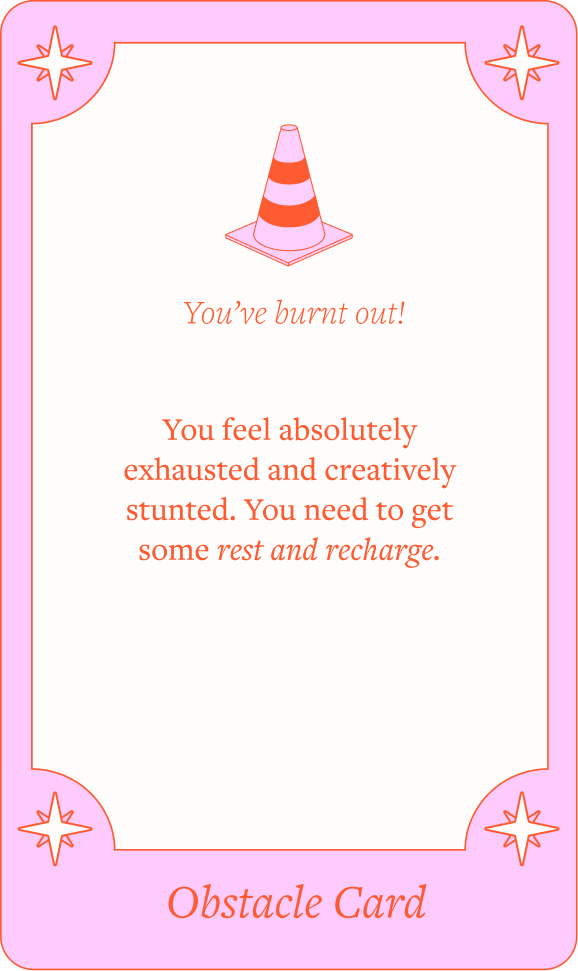
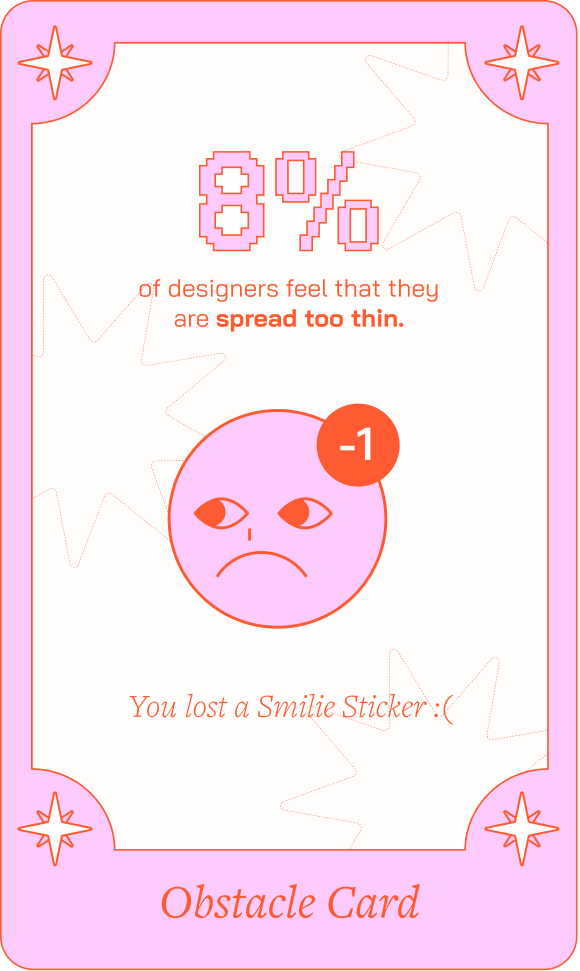
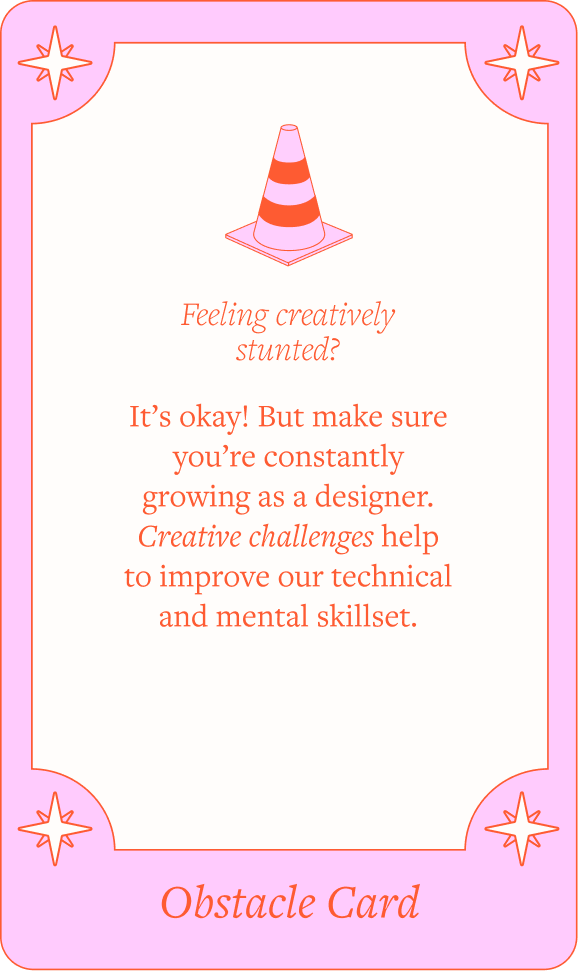
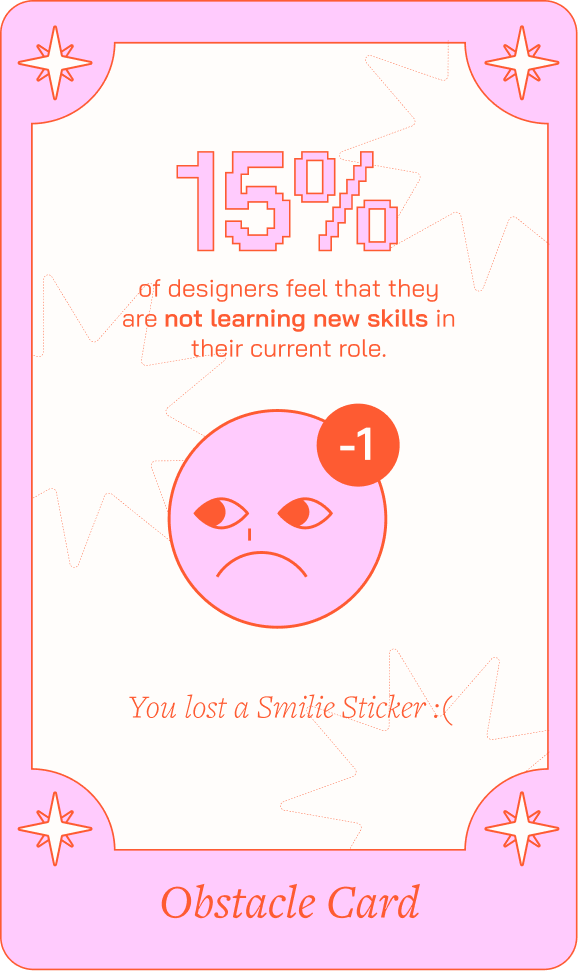
Obstacle Card
Obstacle Card
Presents players with an obstacle scenario where they learn facts about the industry and have a happy face sticker taken away.
Click to view variations
Card Type 04
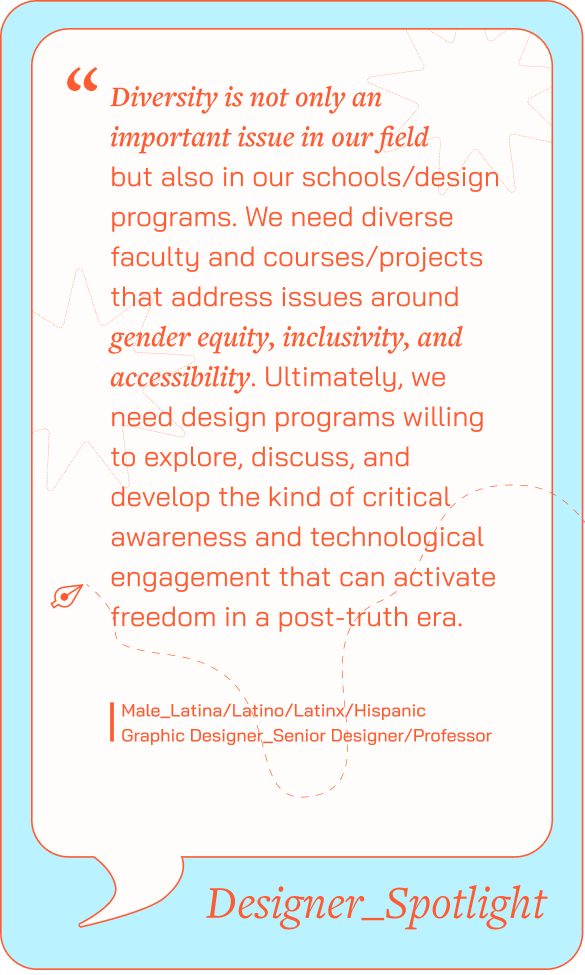
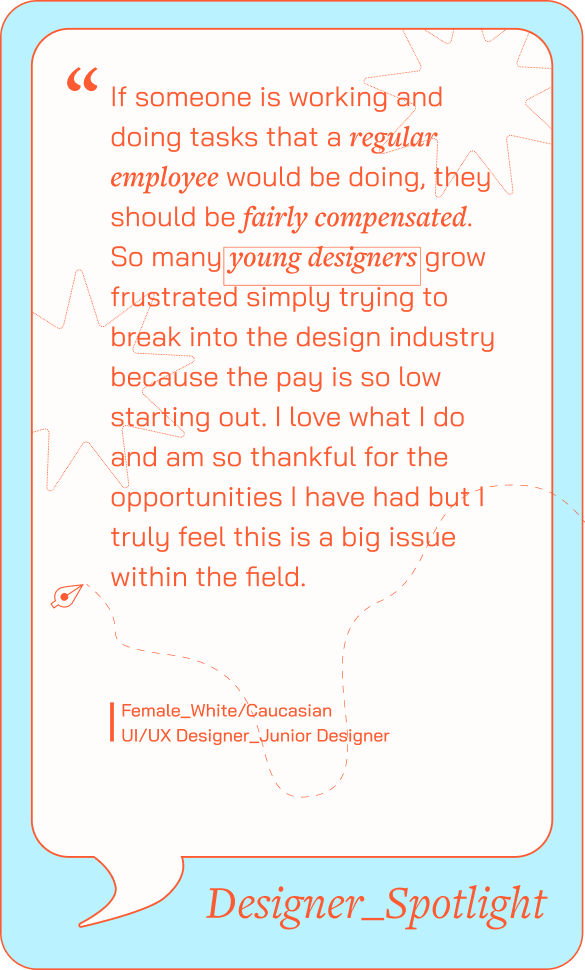
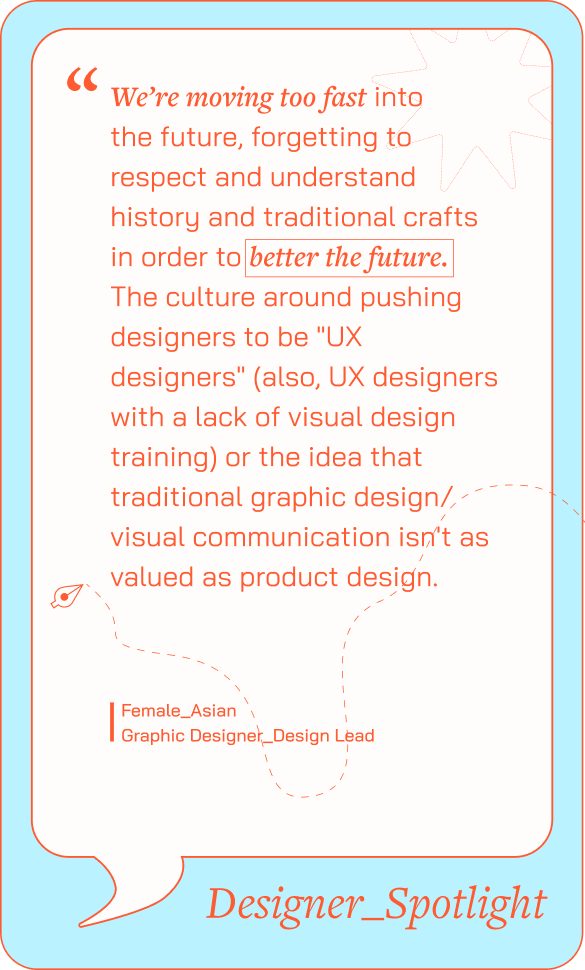
Quote Card
Introduces a quote by a real designer, offering a personal perspective on the design industry.
Click to view variations
Card Type 05
Risk Card
Risk Card
Presents players with scenarios that lead to different outcomes based on their choices. The reverse side of the card displays relevant data related to the chosen outcome.
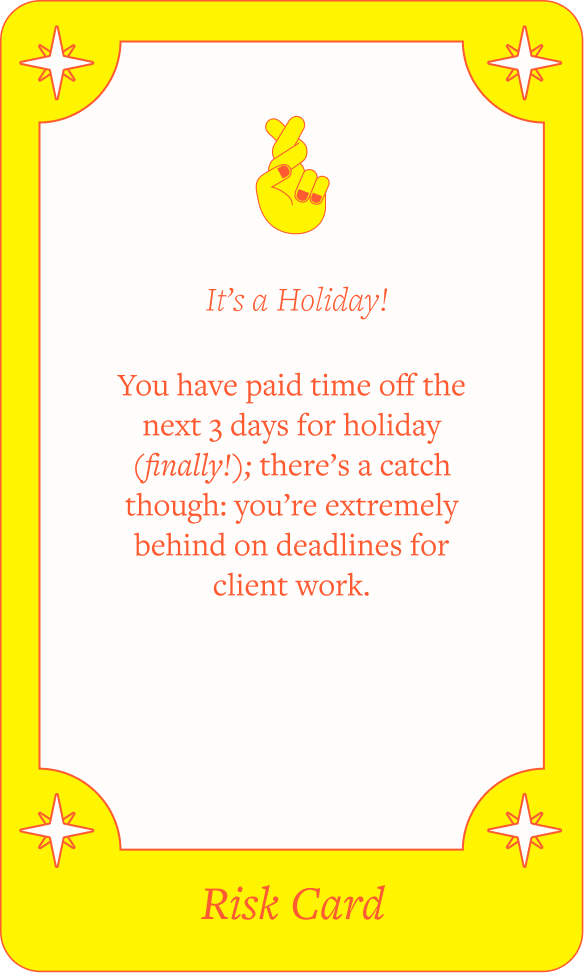
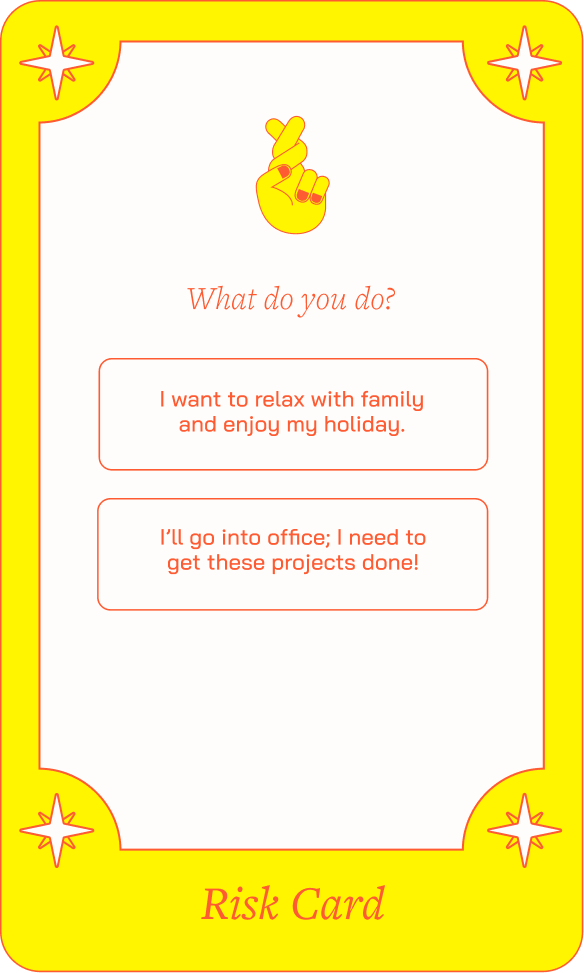
Click to view variations
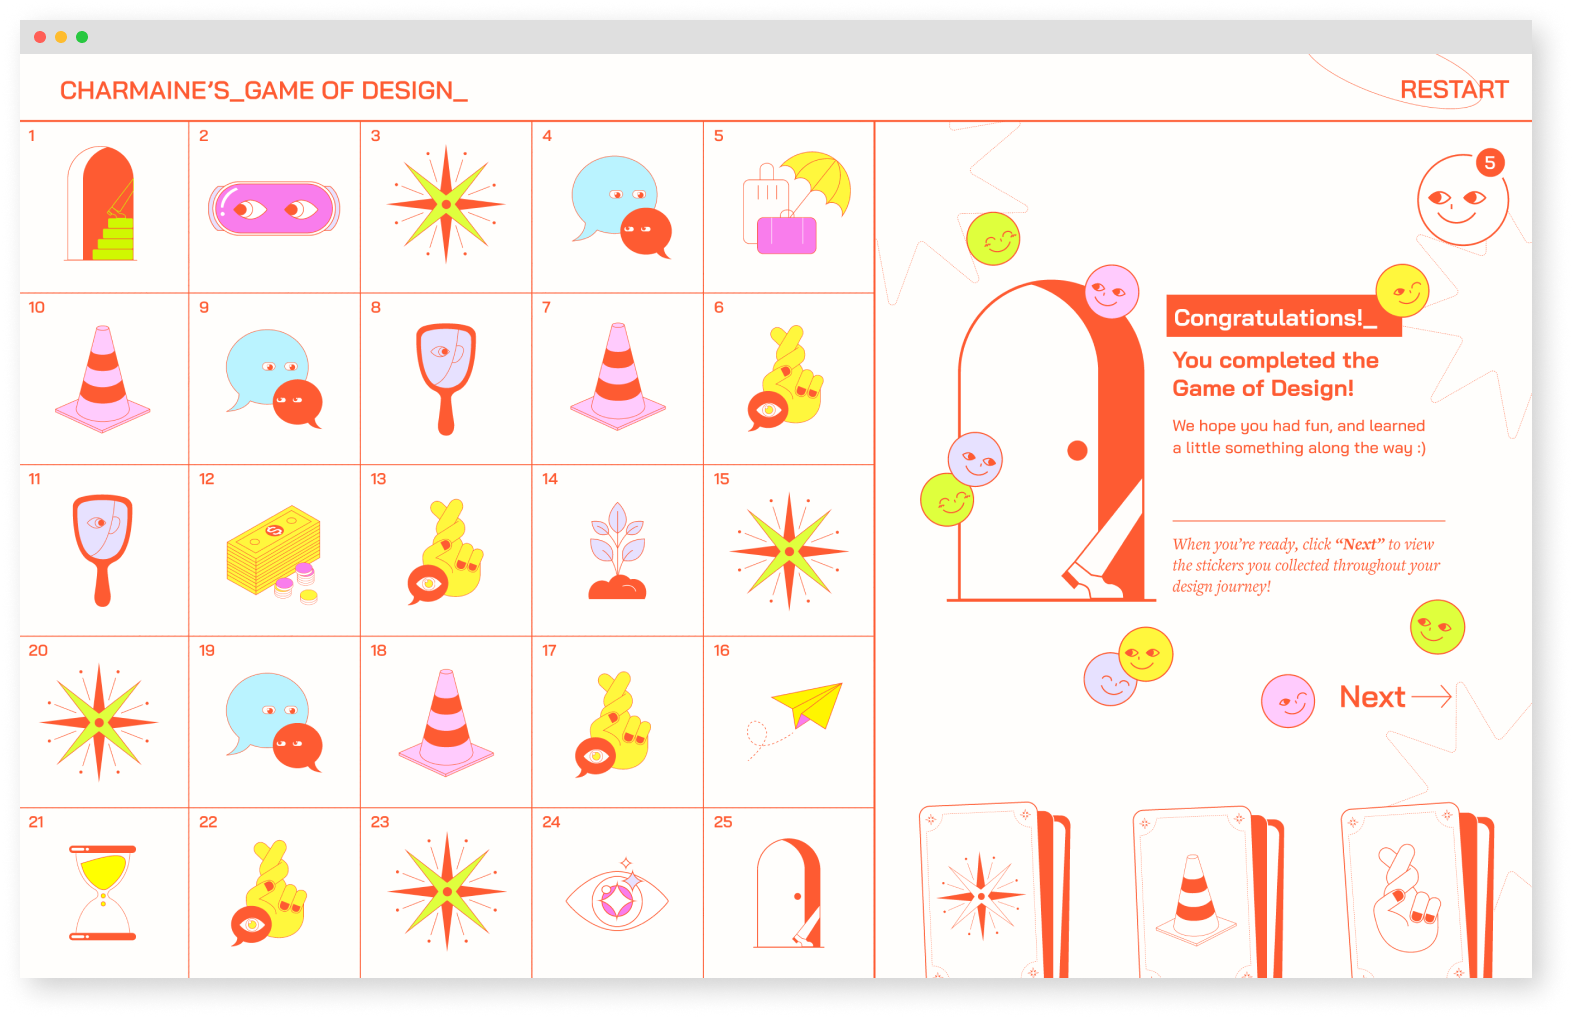
Ending the Journey with Purpose
After navigating through all the blocks, the final screen displays all the stickers collected by the player. Hovering over each sticker reveals the statistics associated with their choices throughout the journey.
Completion page
![]()
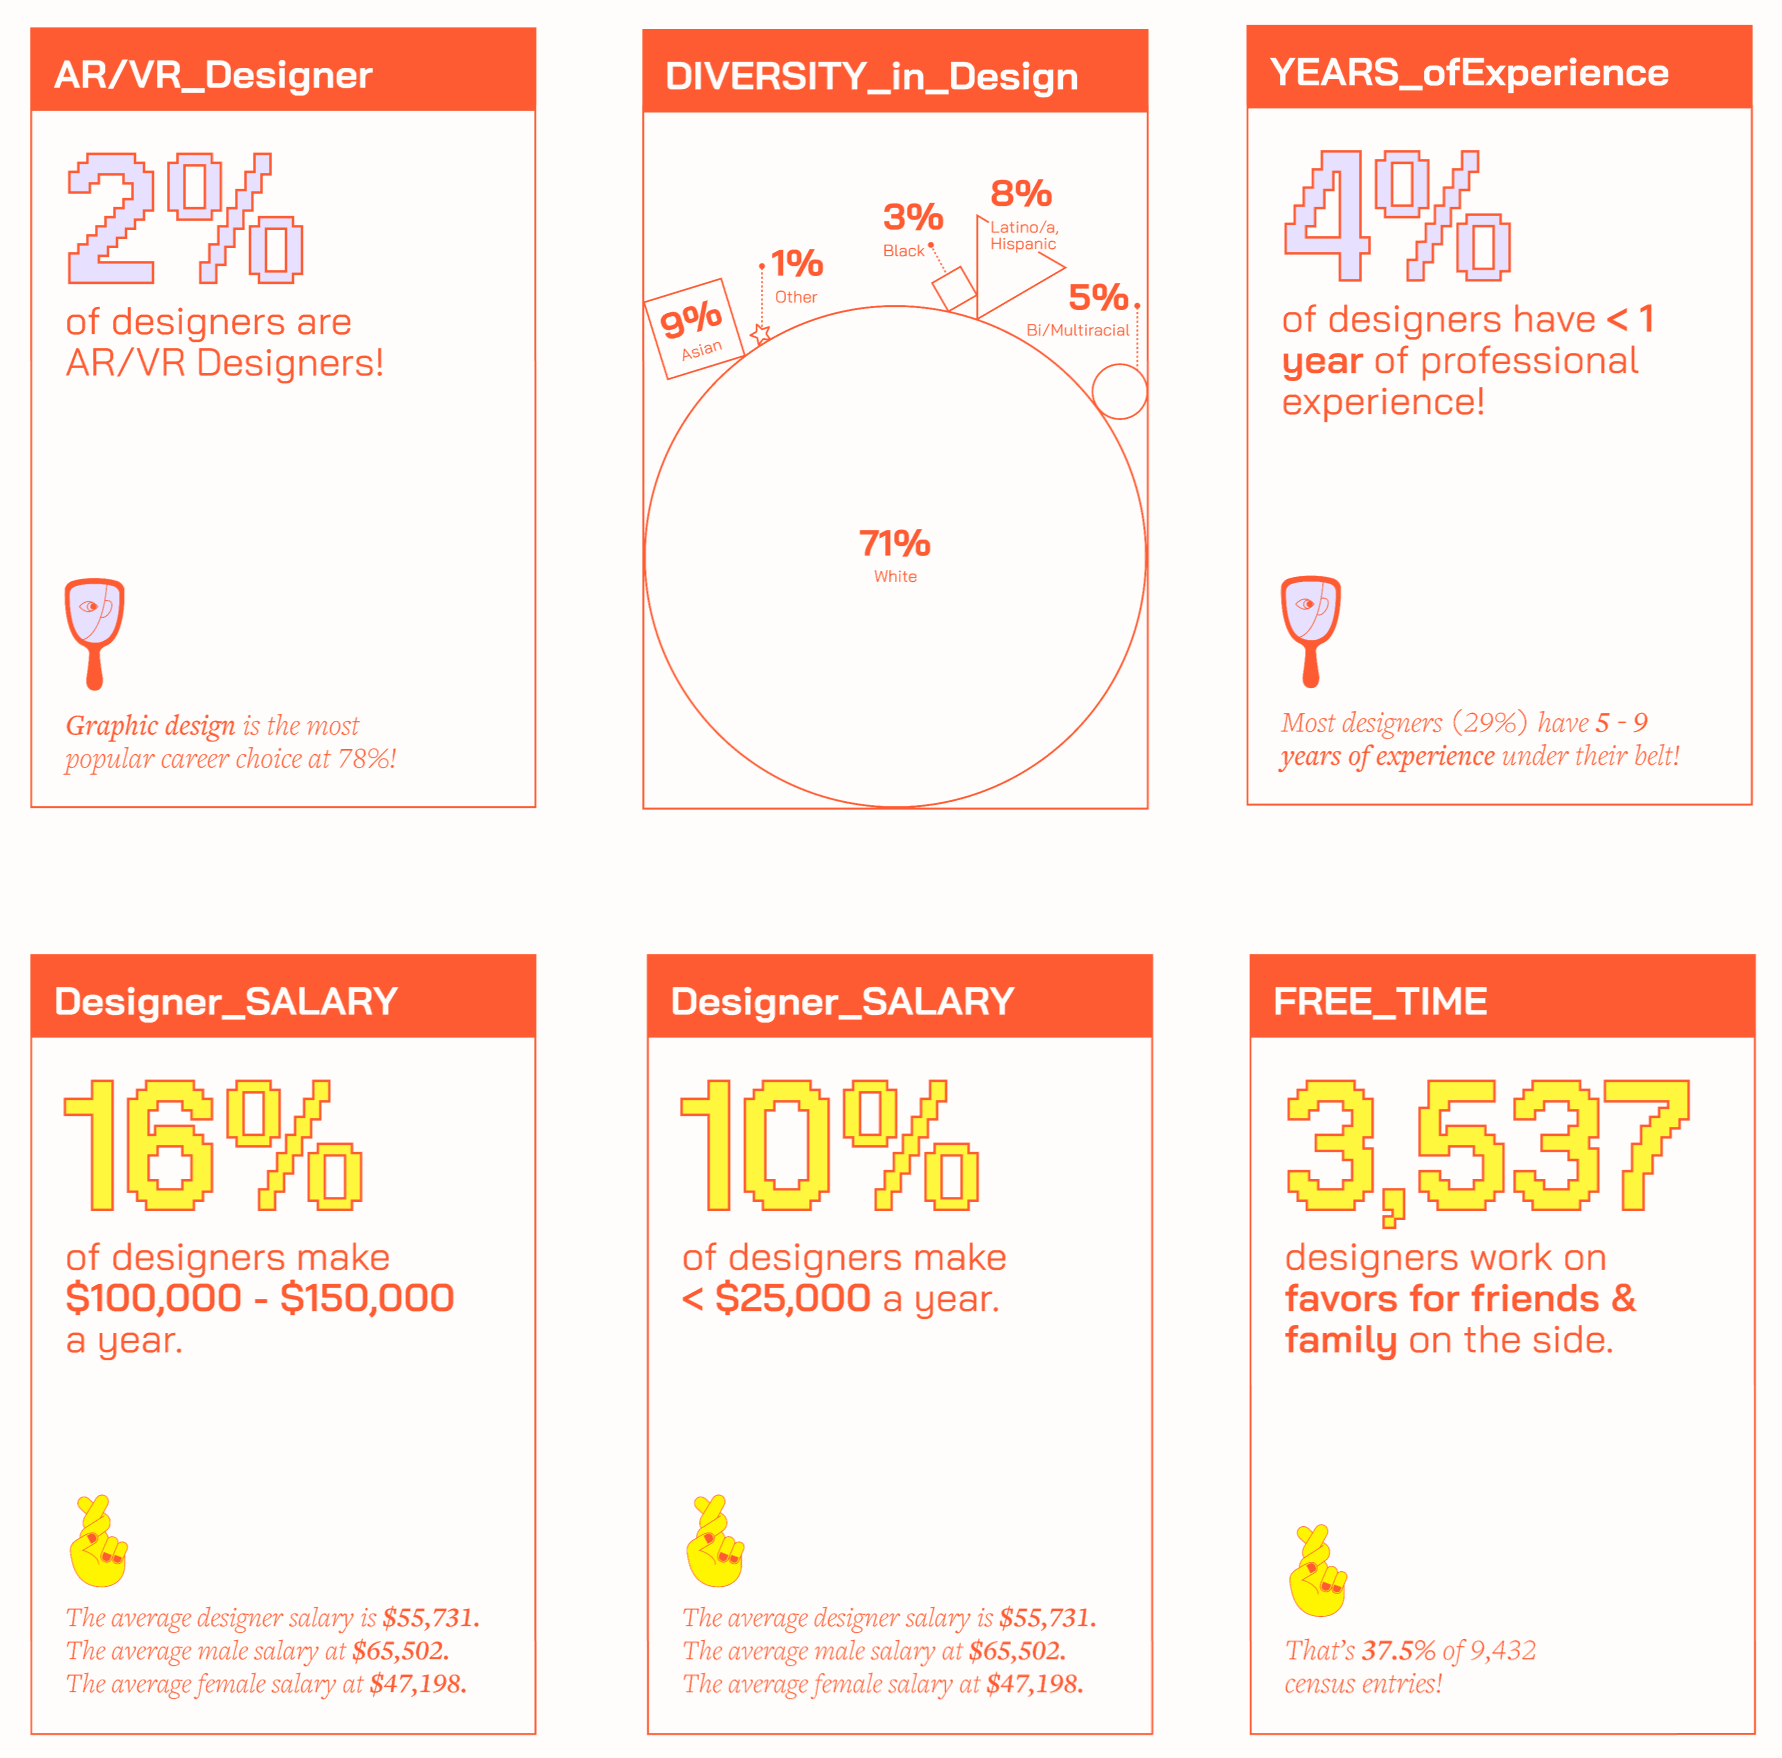
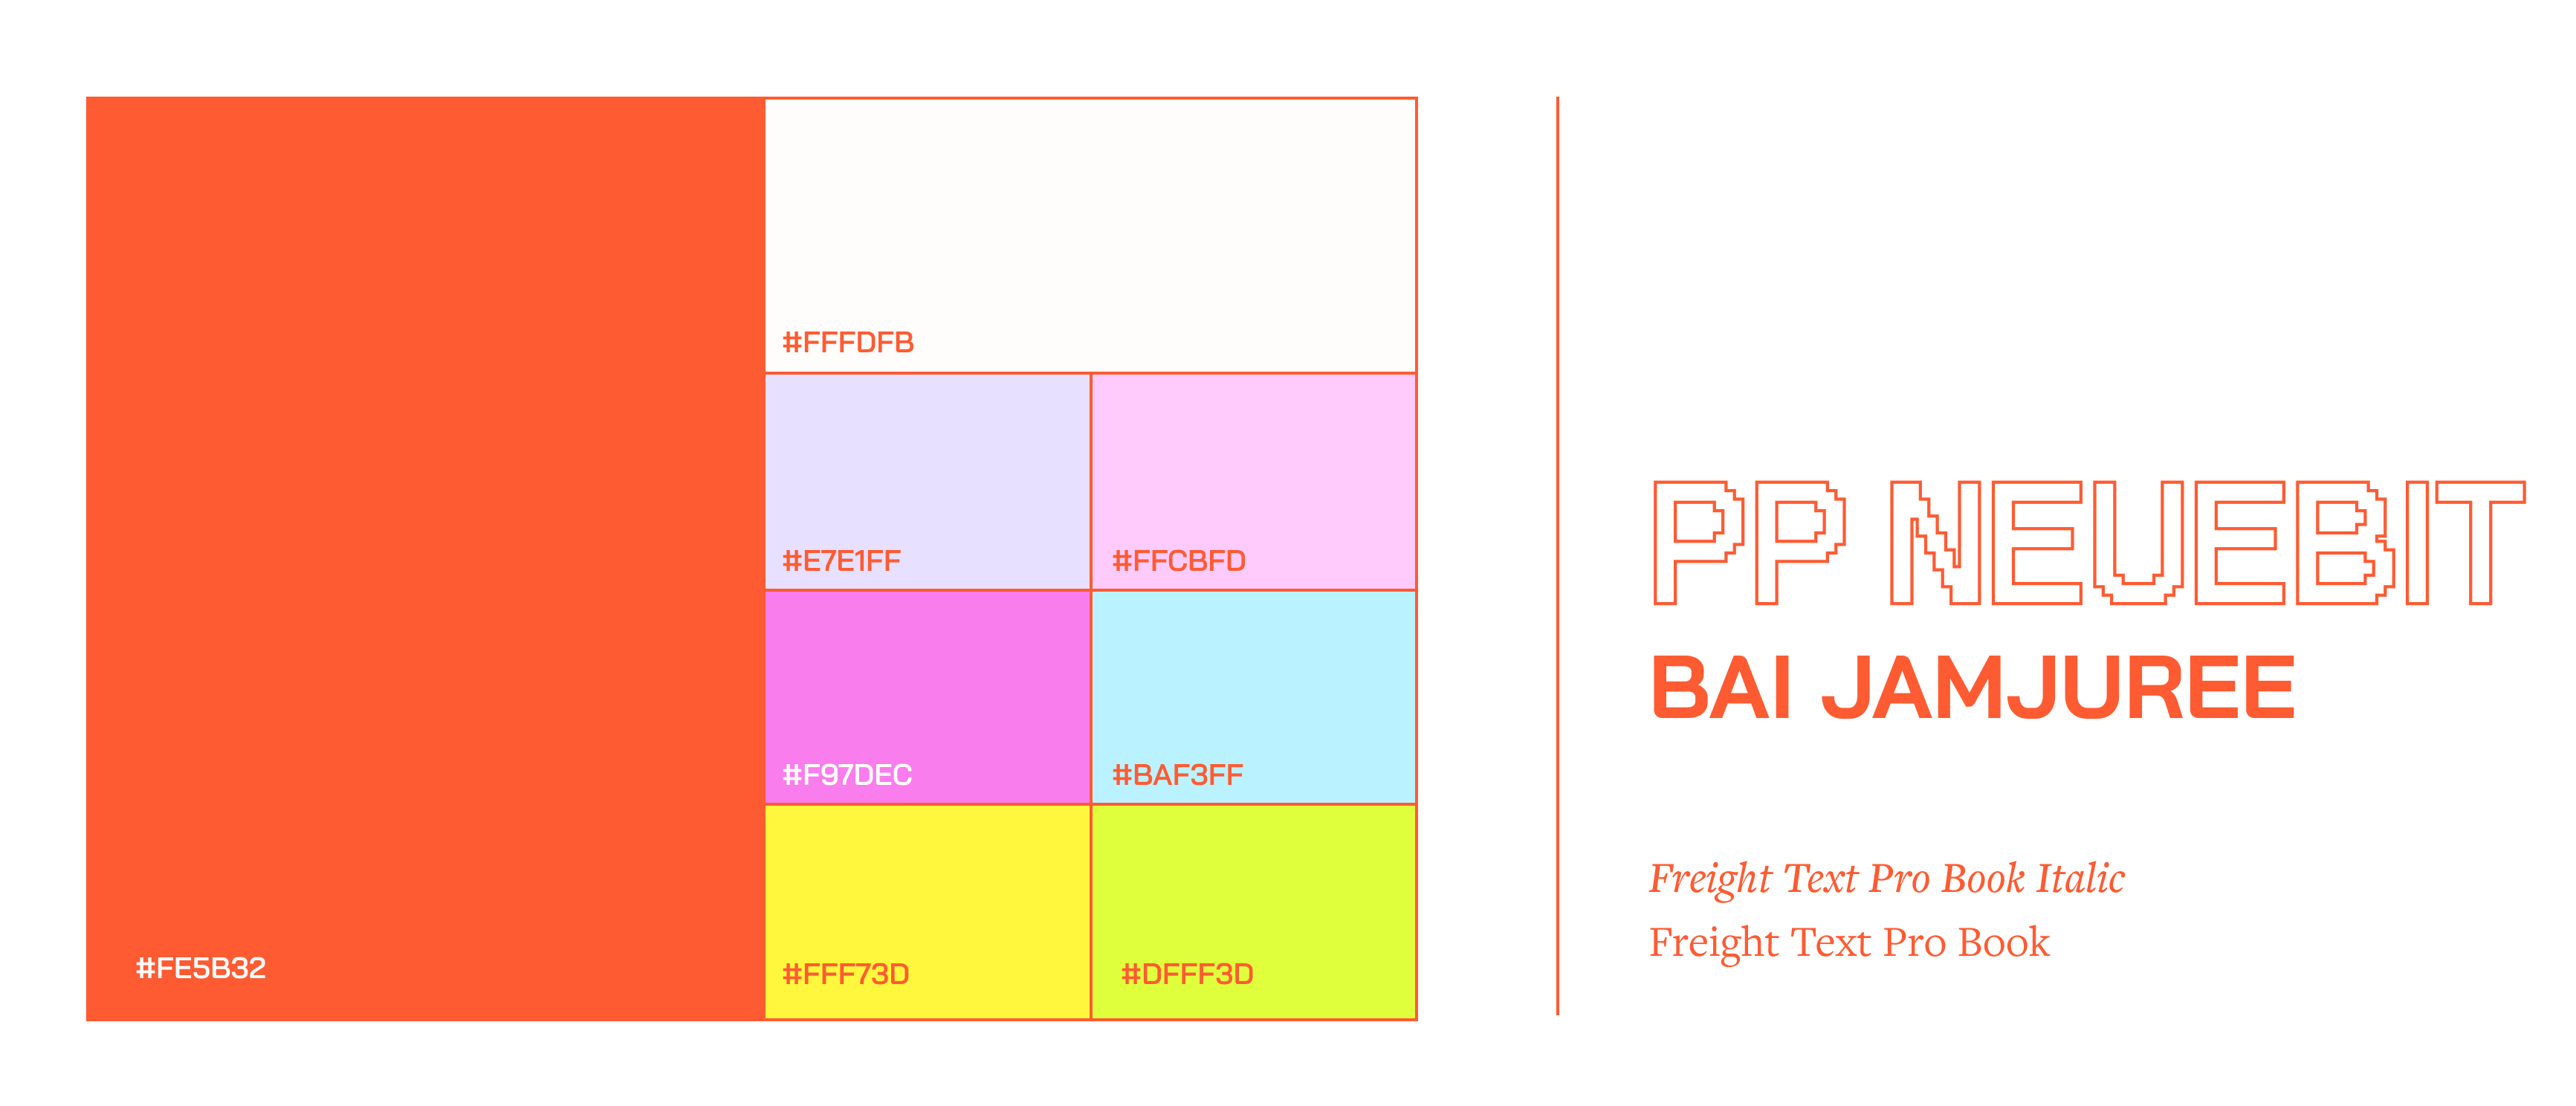
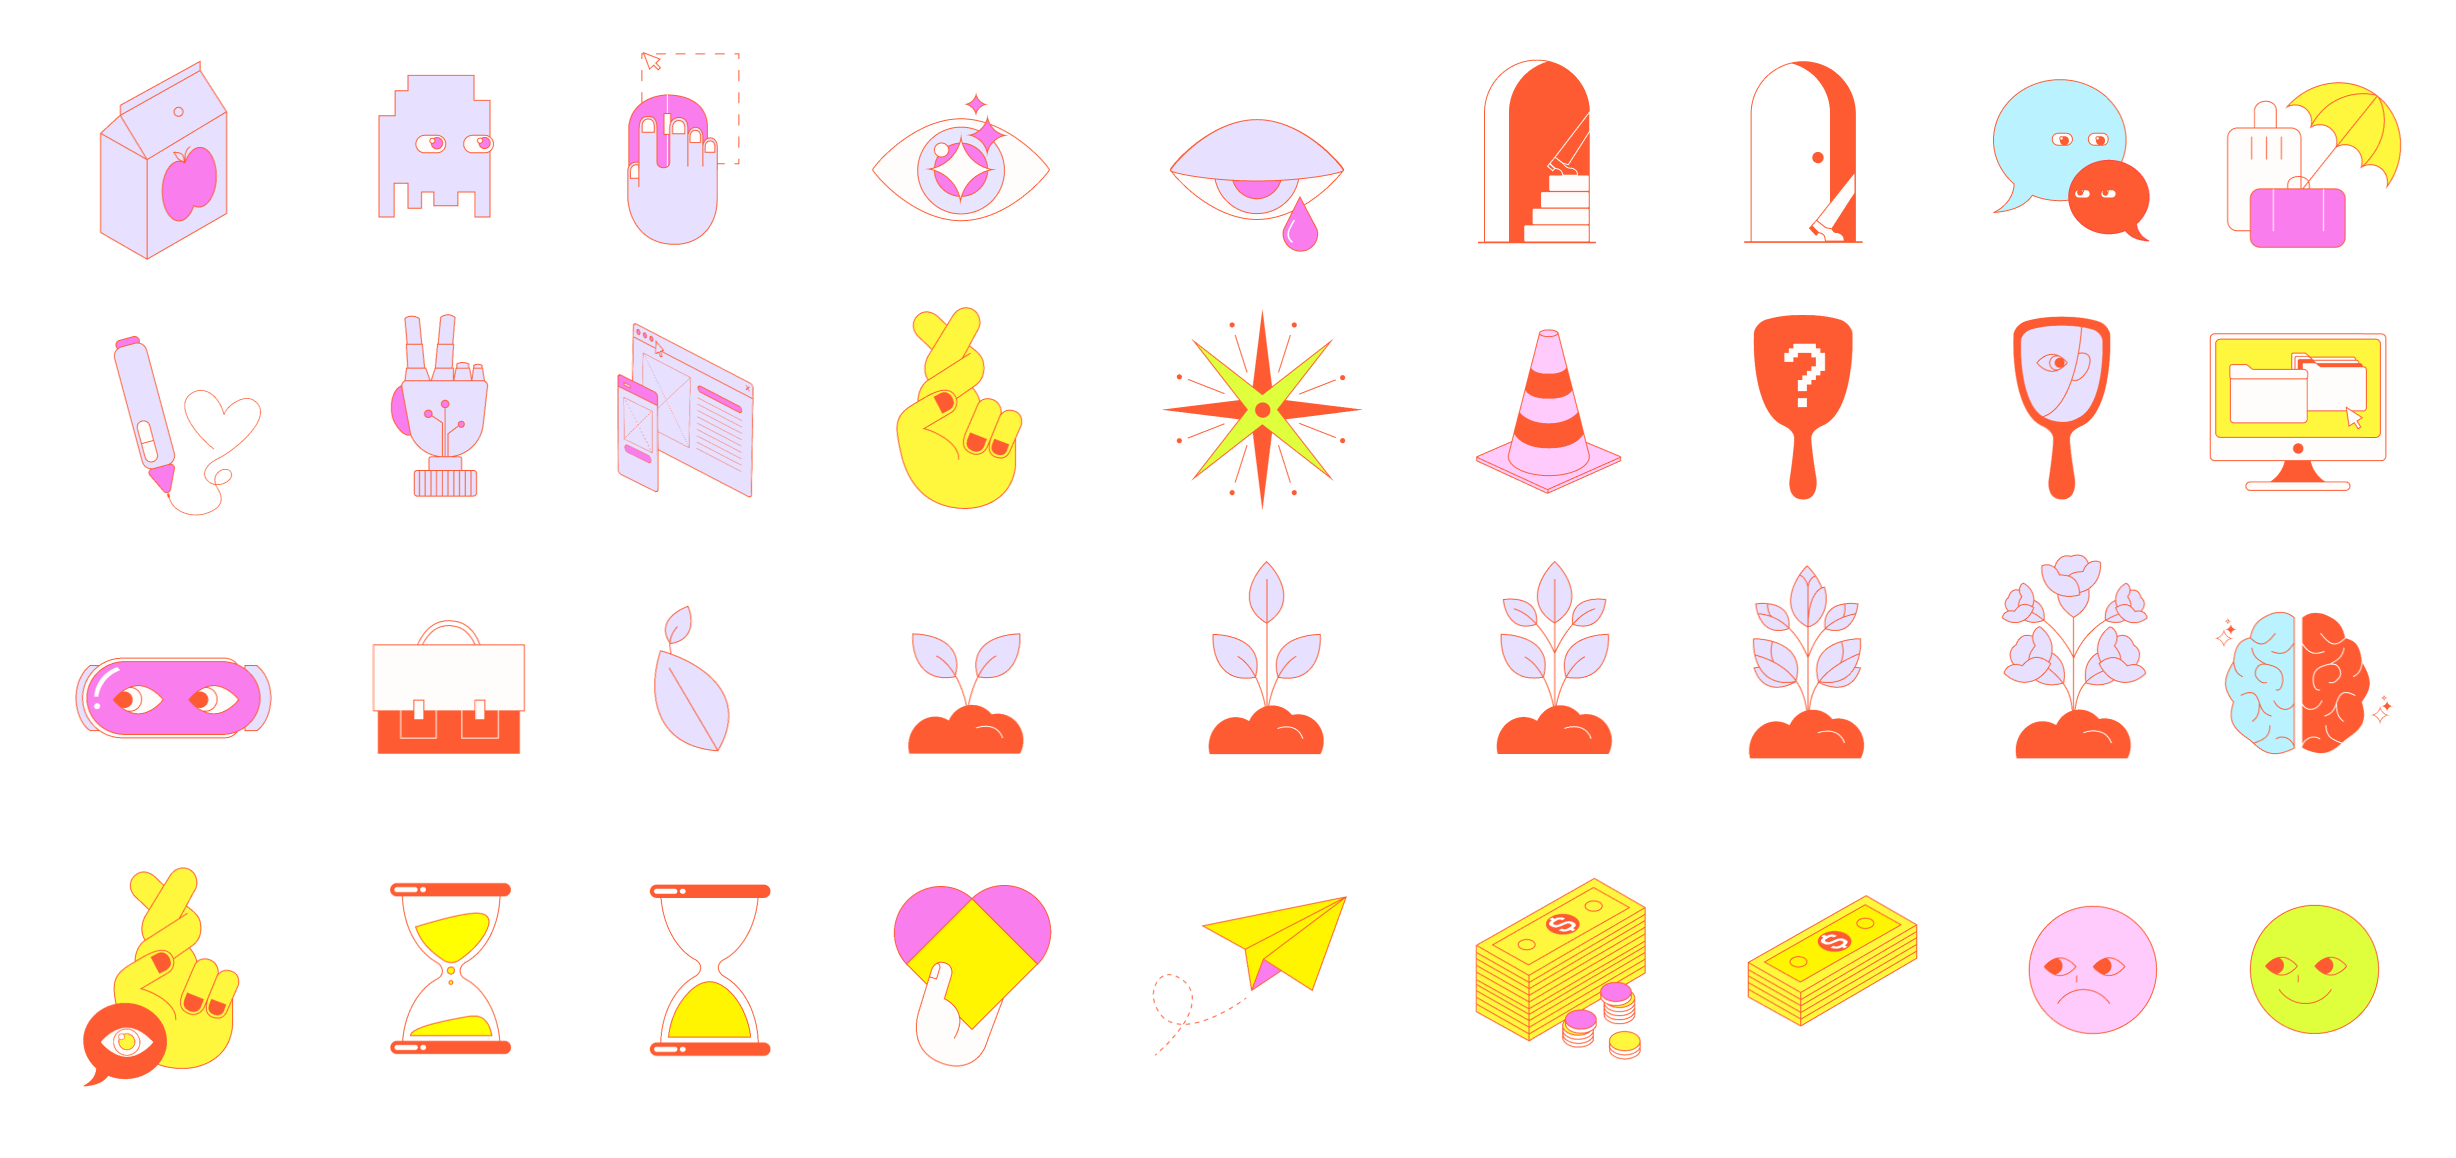
Visual System
Creating a Playful Identity of the Board Game
The use of a game-like typeface and vibrant colors creates a lighthearted mood reminiscent of playing a board game. The accompanying stickers and cards feature a simple yet quirky design, adding extra personality to the brand.
Additionally, we employed various data visualization techniques to introduce diversity across the different types of cards.
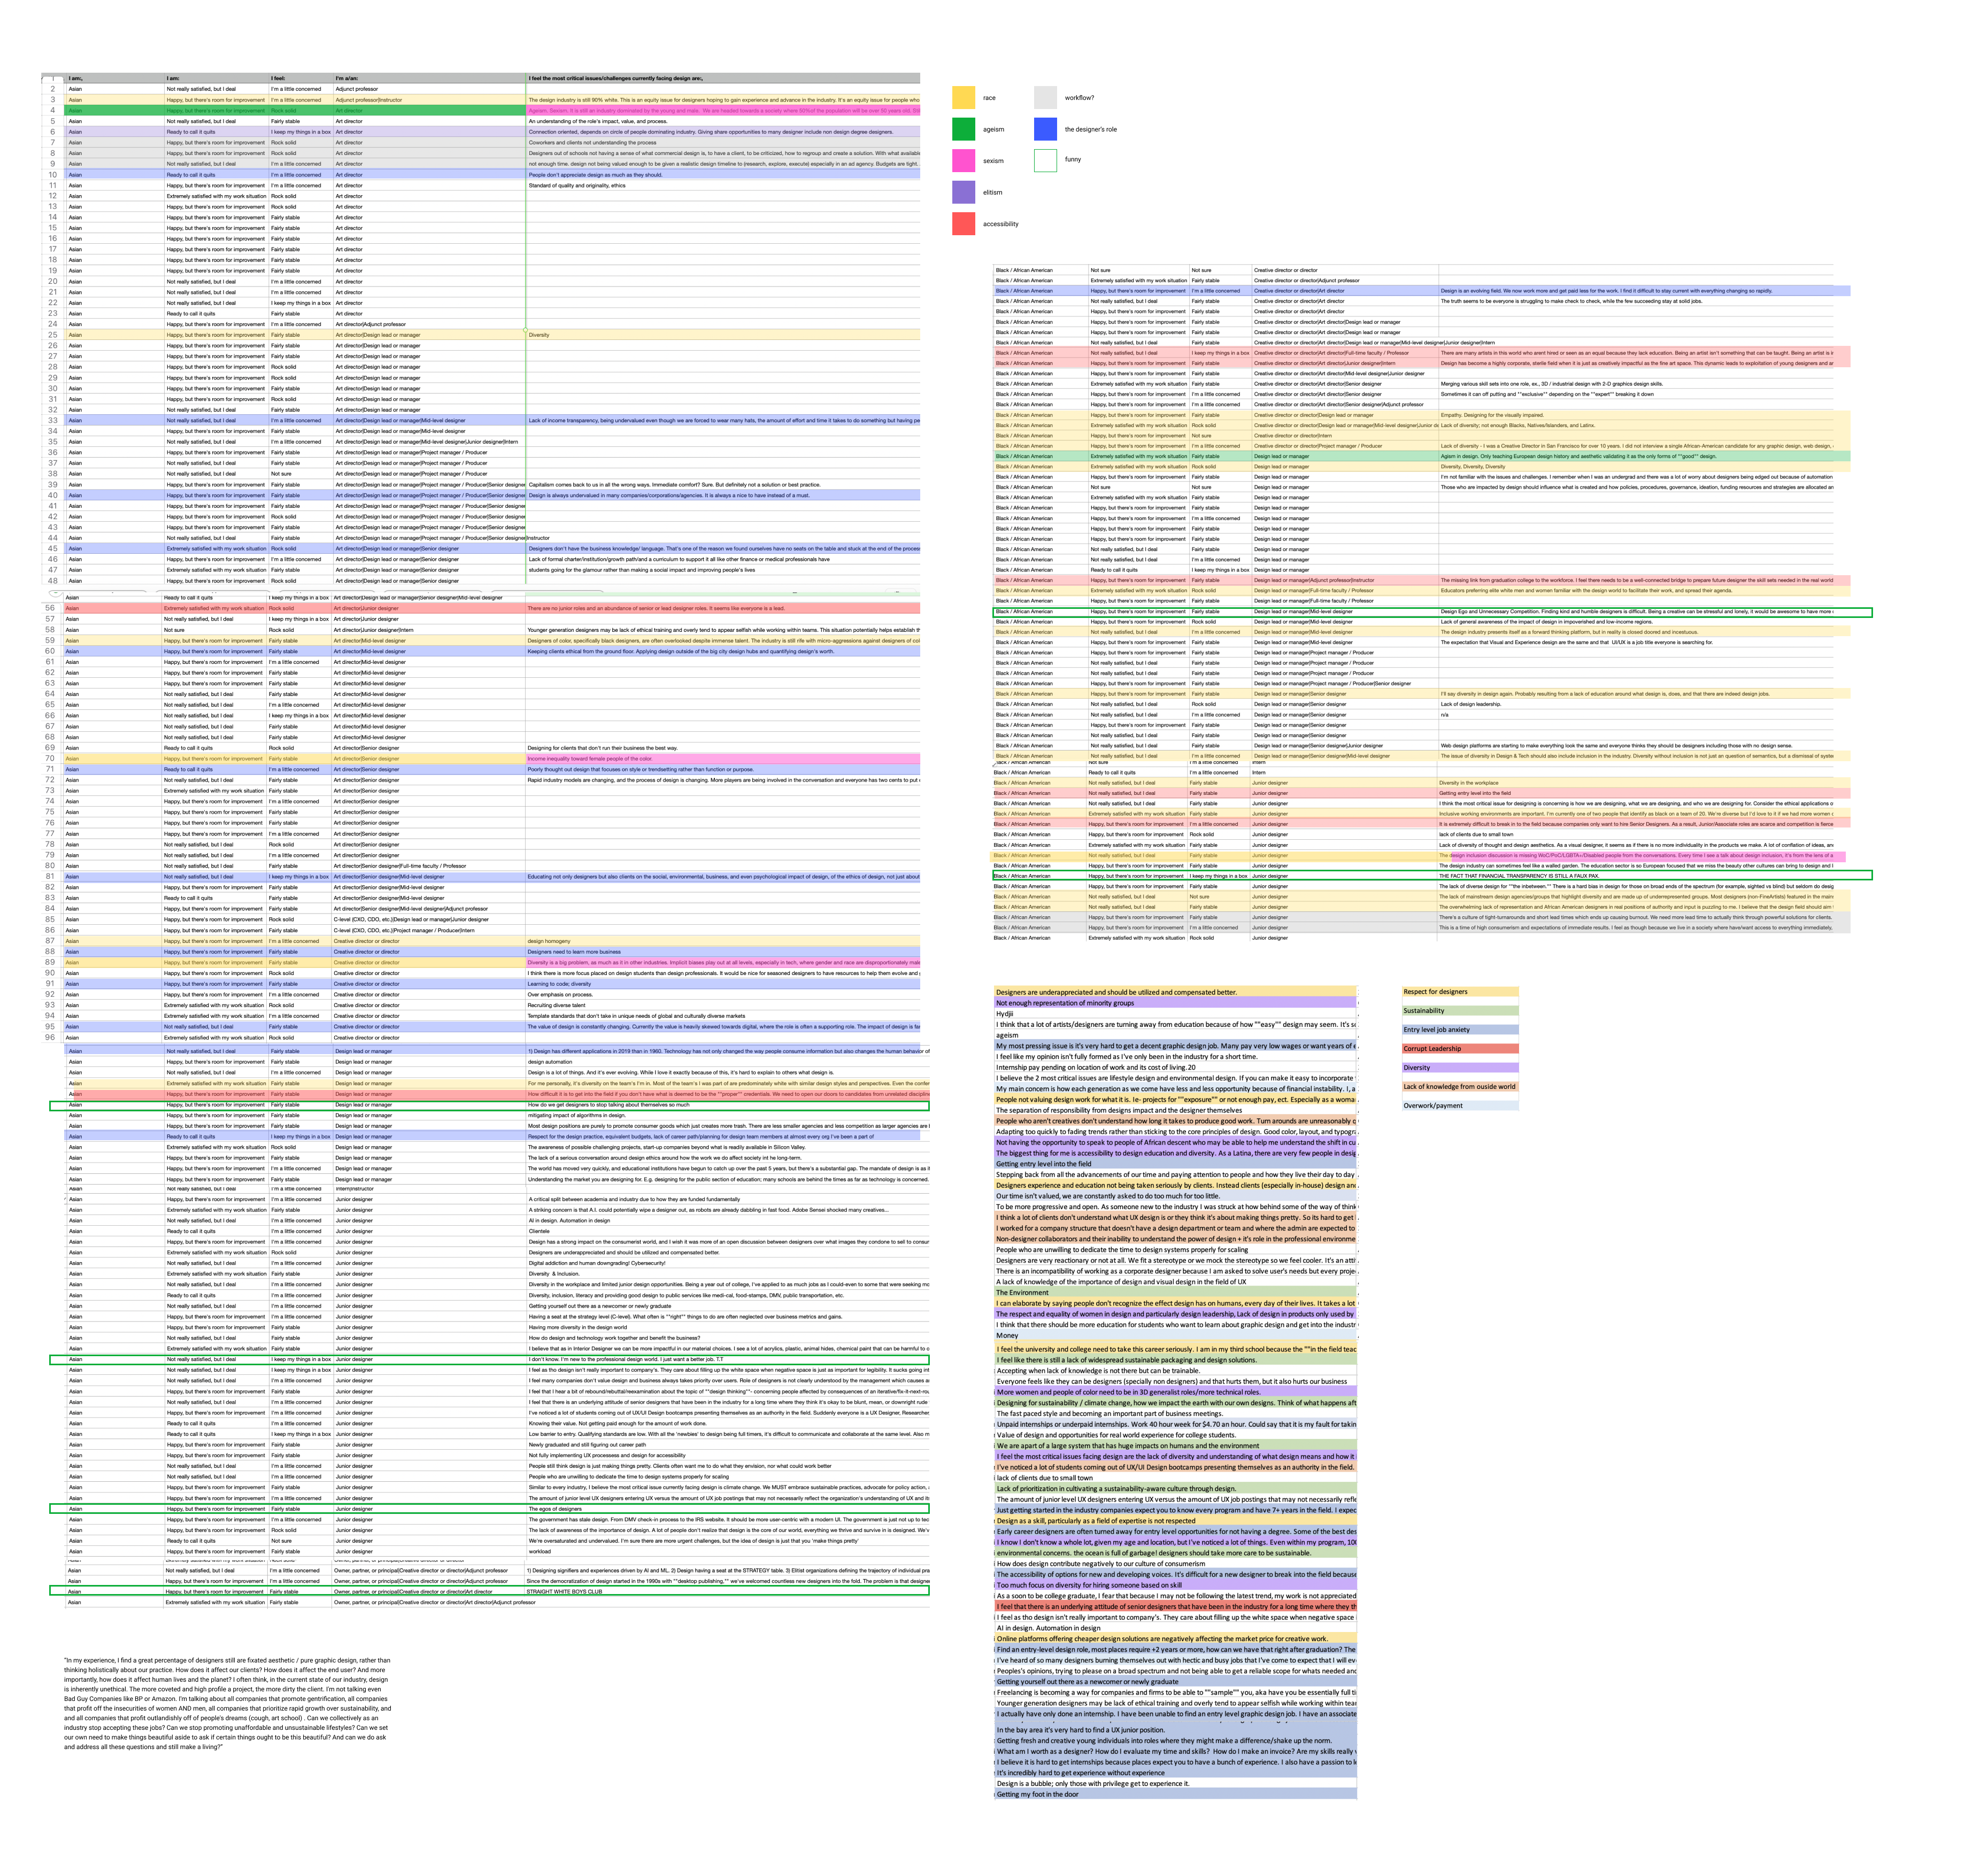
Initial Research
Working with the AIGA Dataset
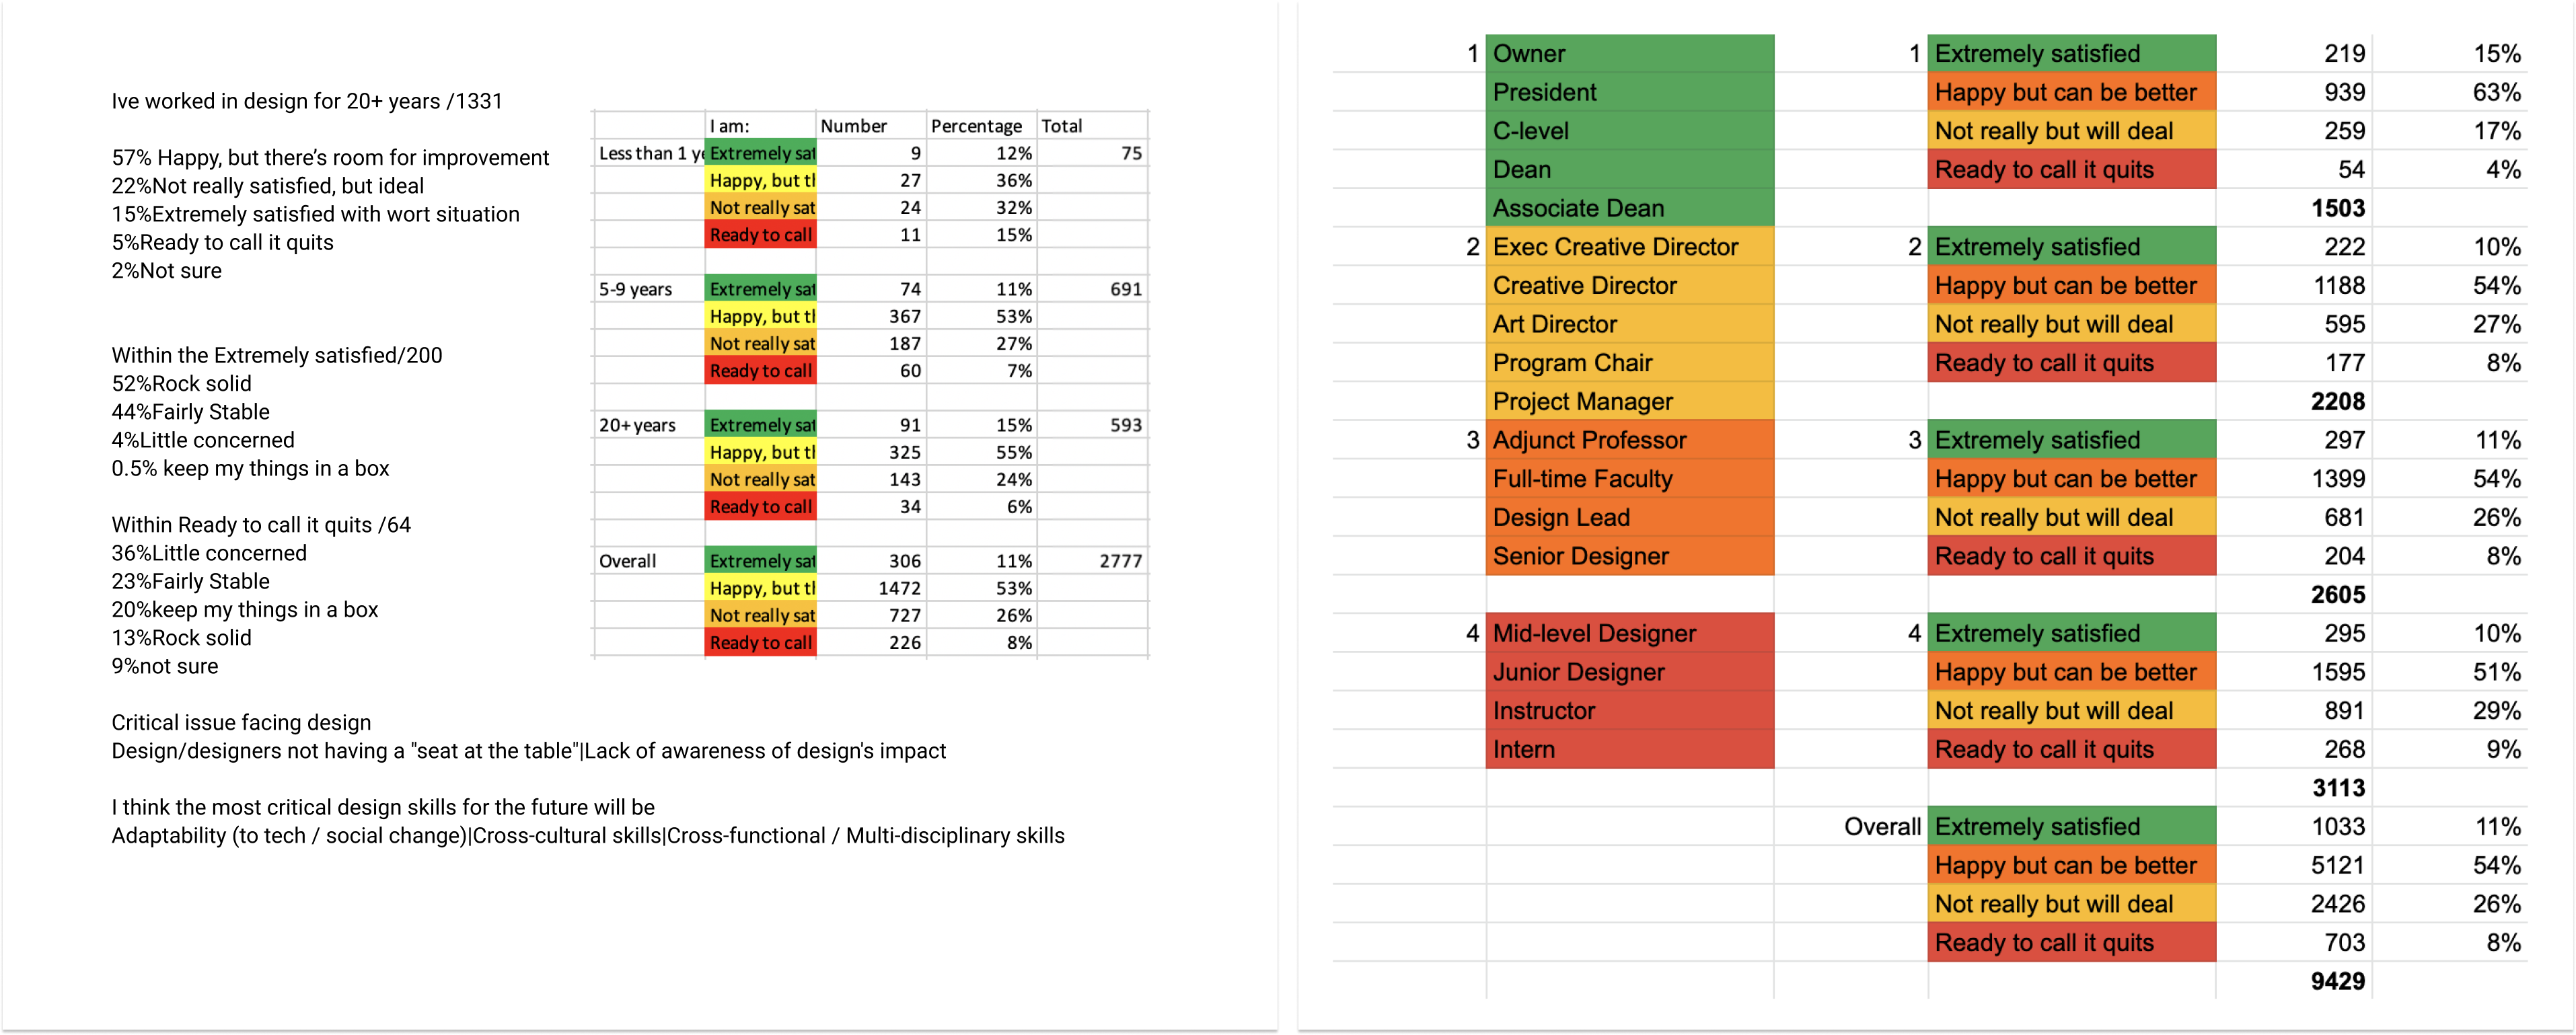
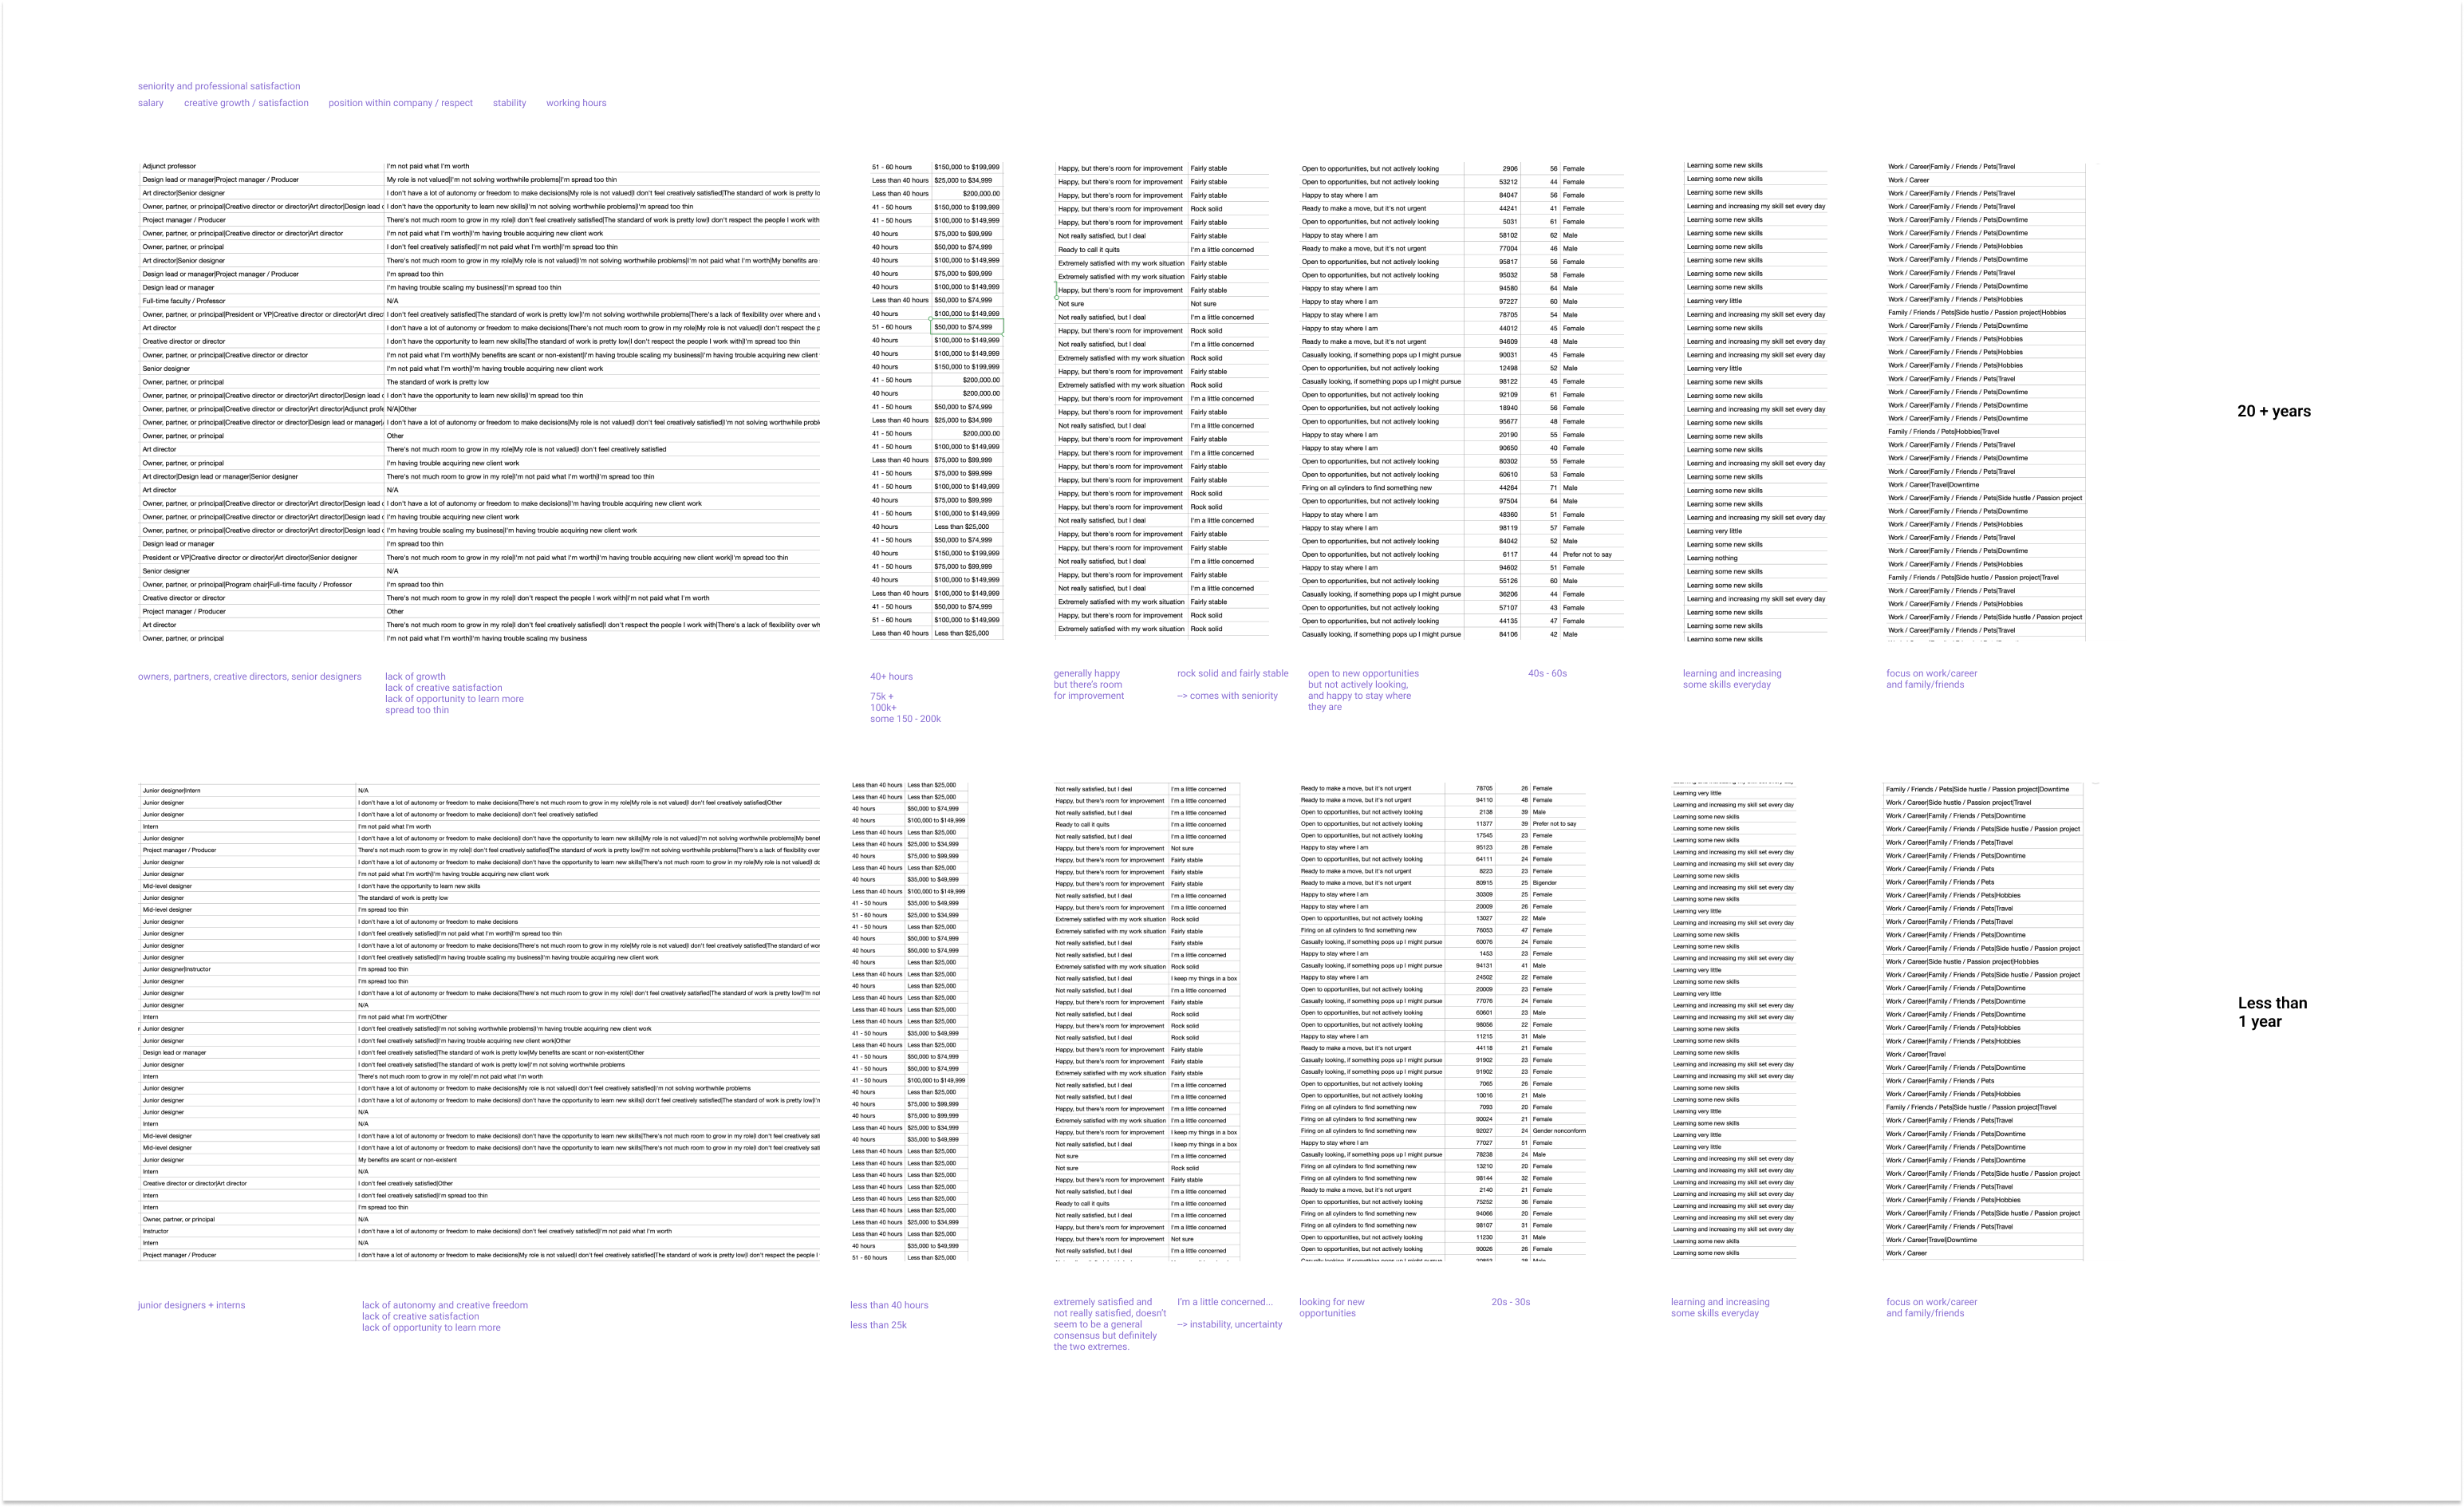
Before beginning the design process, our team analyzed the dataset to identify correlations between different categories. We were particularly interested in designers' job satisfaction and compared these levels across various factors such as job title, salary, years of experience, and gender.
![]()
![]()
![]()
The Concept
The Board Game Narrative
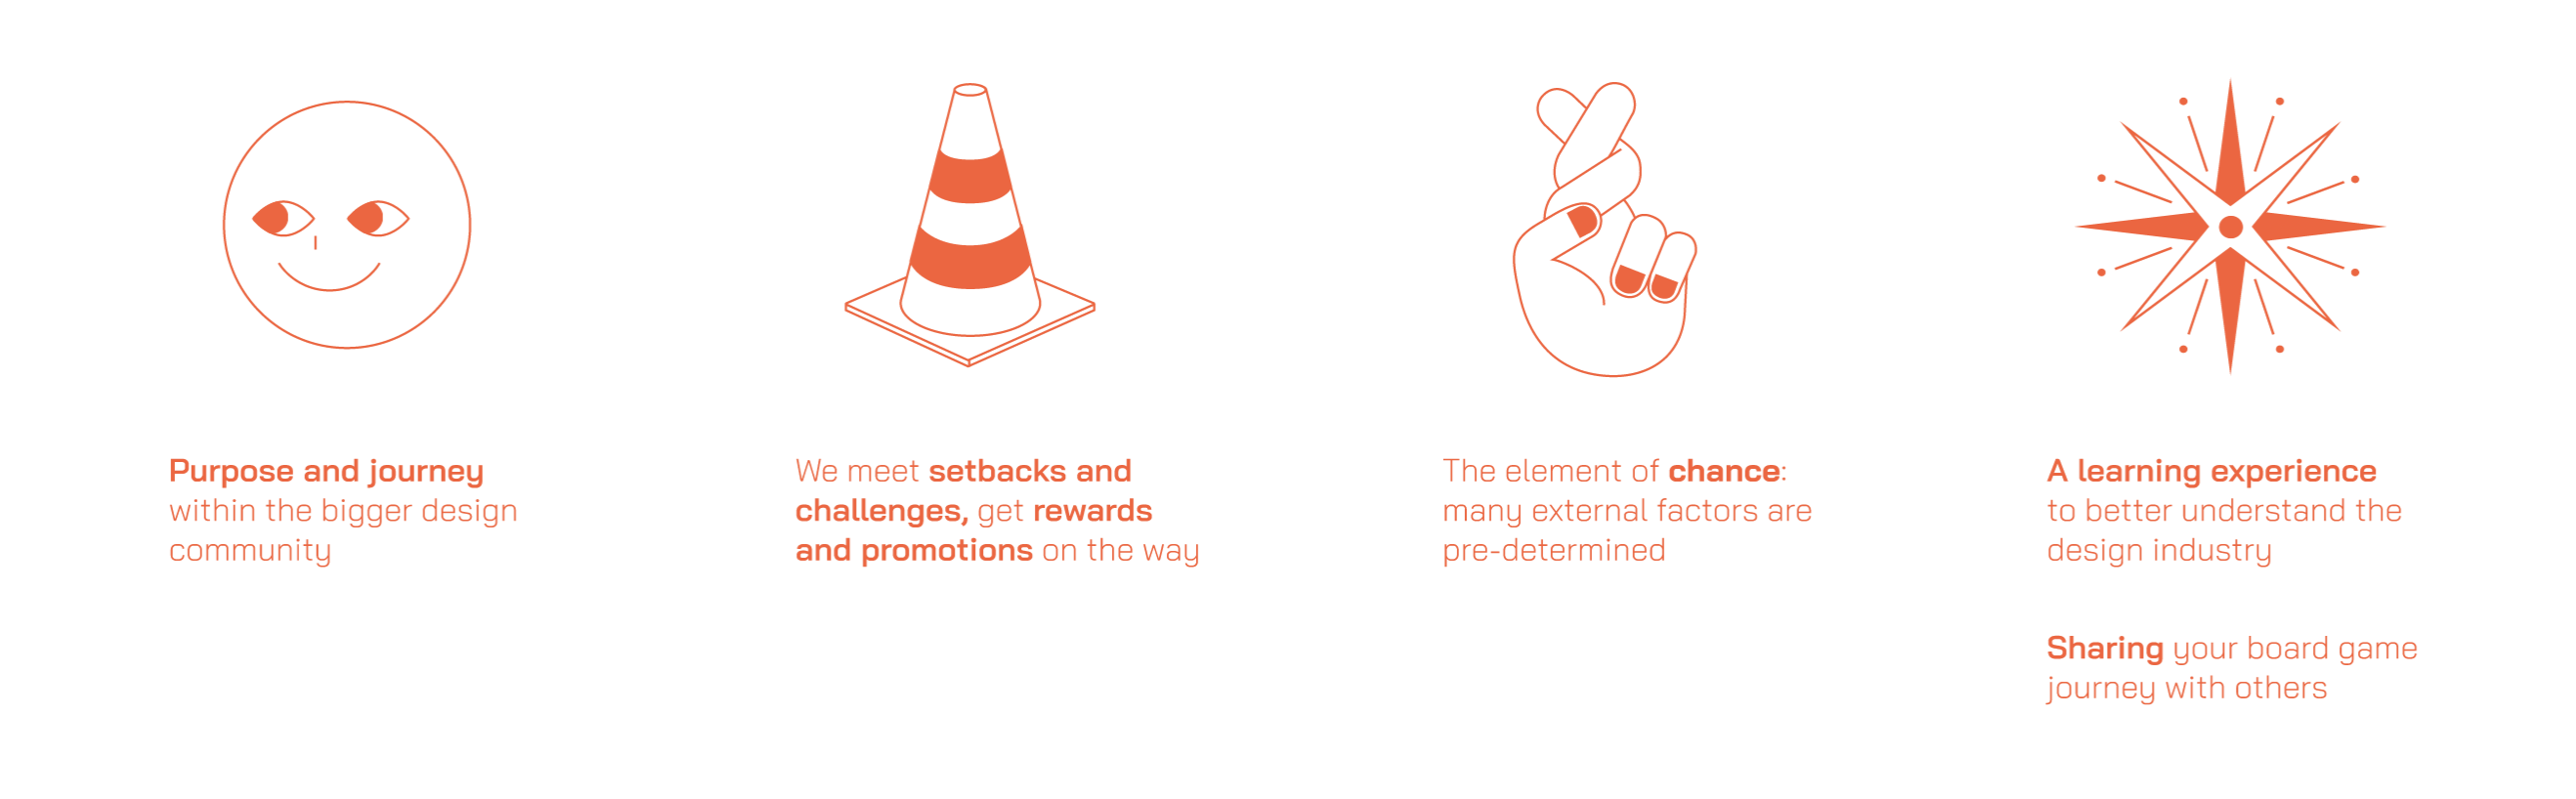
Our team chose to create a digital board game because it serves as a metaphor for an unpredictable yet charming journey filled with challenges and surprises. We recognized the opportunity to integrate various interactions that lead to unique outcomes throughout the journey.
![]()
Working with the AIGA Dataset
Before beginning the design process, our team analyzed the dataset to identify correlations between different categories. We were particularly interested in designers' job satisfaction and compared these levels across various factors such as job title, salary, years of experience, and gender.
The Concept
The Board Game Narrative
Our team chose to create a digital board game because it serves as a metaphor for an unpredictable yet charming journey filled with challenges and surprises. We recognized the opportunity to integrate various interactions that lead to unique outcomes throughout the journey.
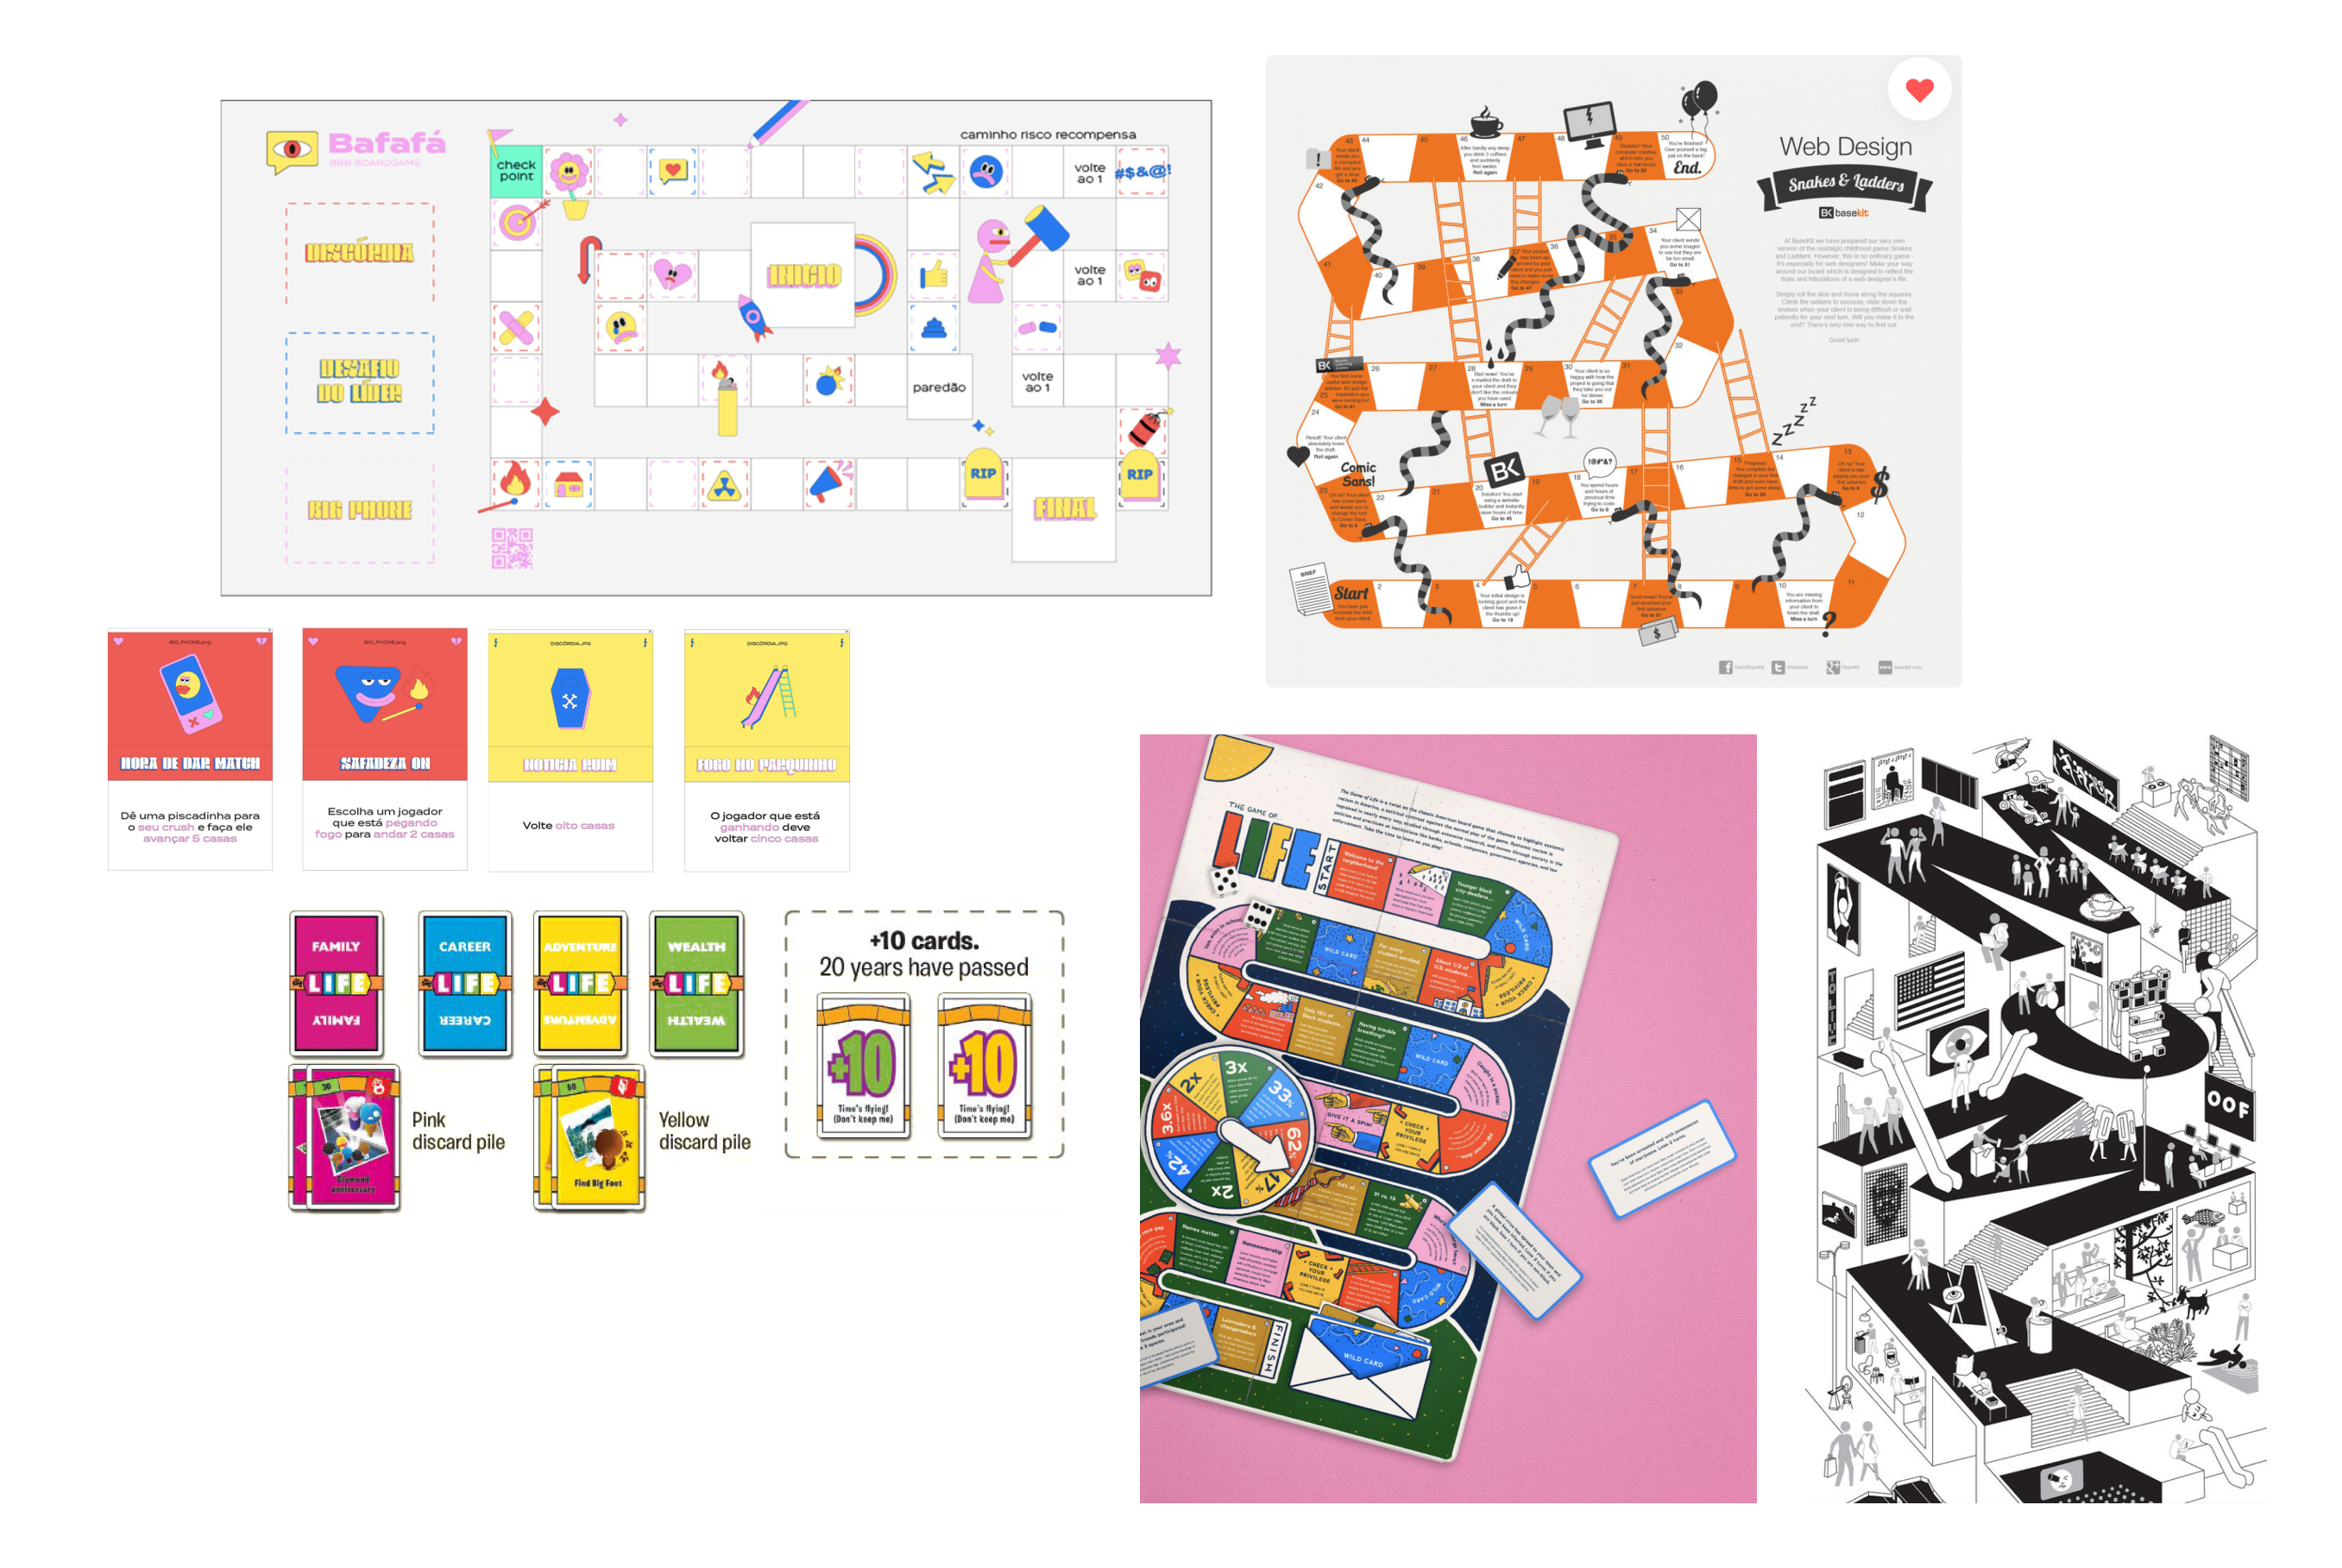
Moodboard
When designing the layout of the board, we focused on achieving an optimal balance between the board itself, the cards, and the collected stickers. We settled on a layout that features an overview of the board, allowing users to track their progress through the journey while engaging with the interactive elements of the cards. 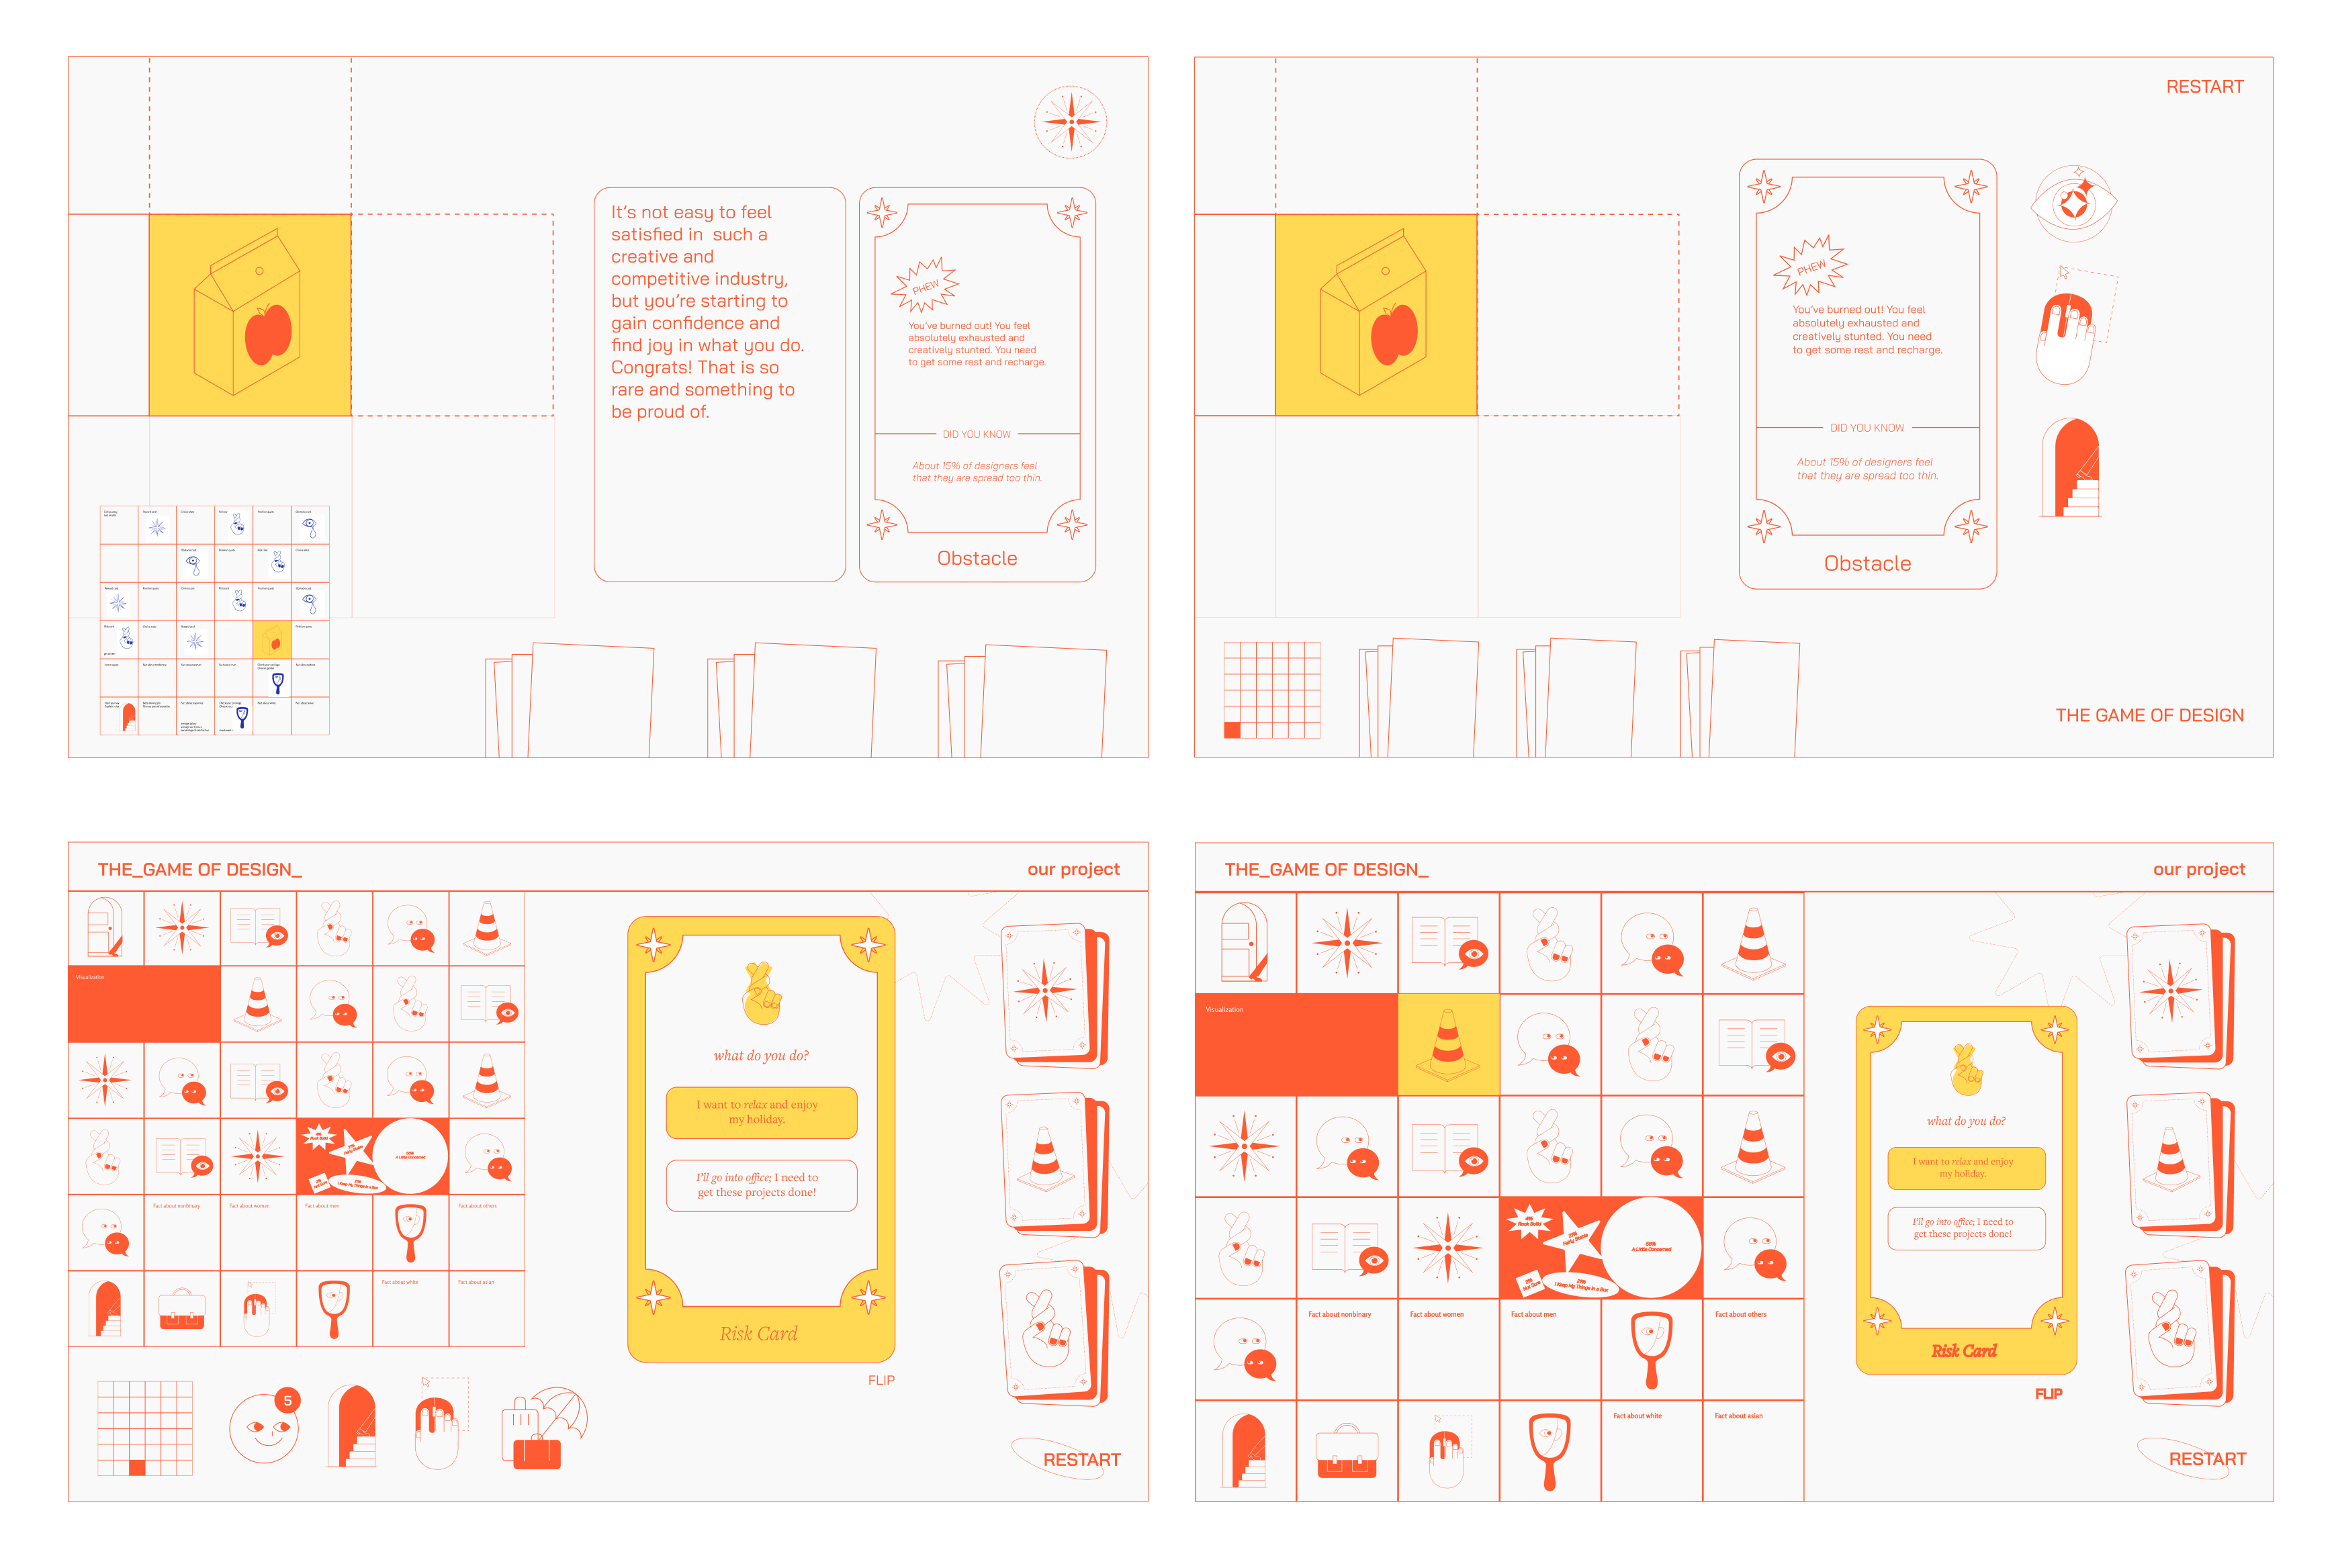
Layout exploration
Reflection
This project provided me with the opportunity to delve into data visualization through the creation of a digital game, adopting a highly visual approach. It was intriguing to integrate customization features of the game as educational tools. After establishing the visual system and the flow of the board, I transitioned to an asset-based workflow, preparing assets for delivery to the developer.
Given more time, I would explore additional micro-interactions, such as sticker animations and dynamic hints, to maintain engagement throughout the journey.
© CHARMAINE QIU 2025